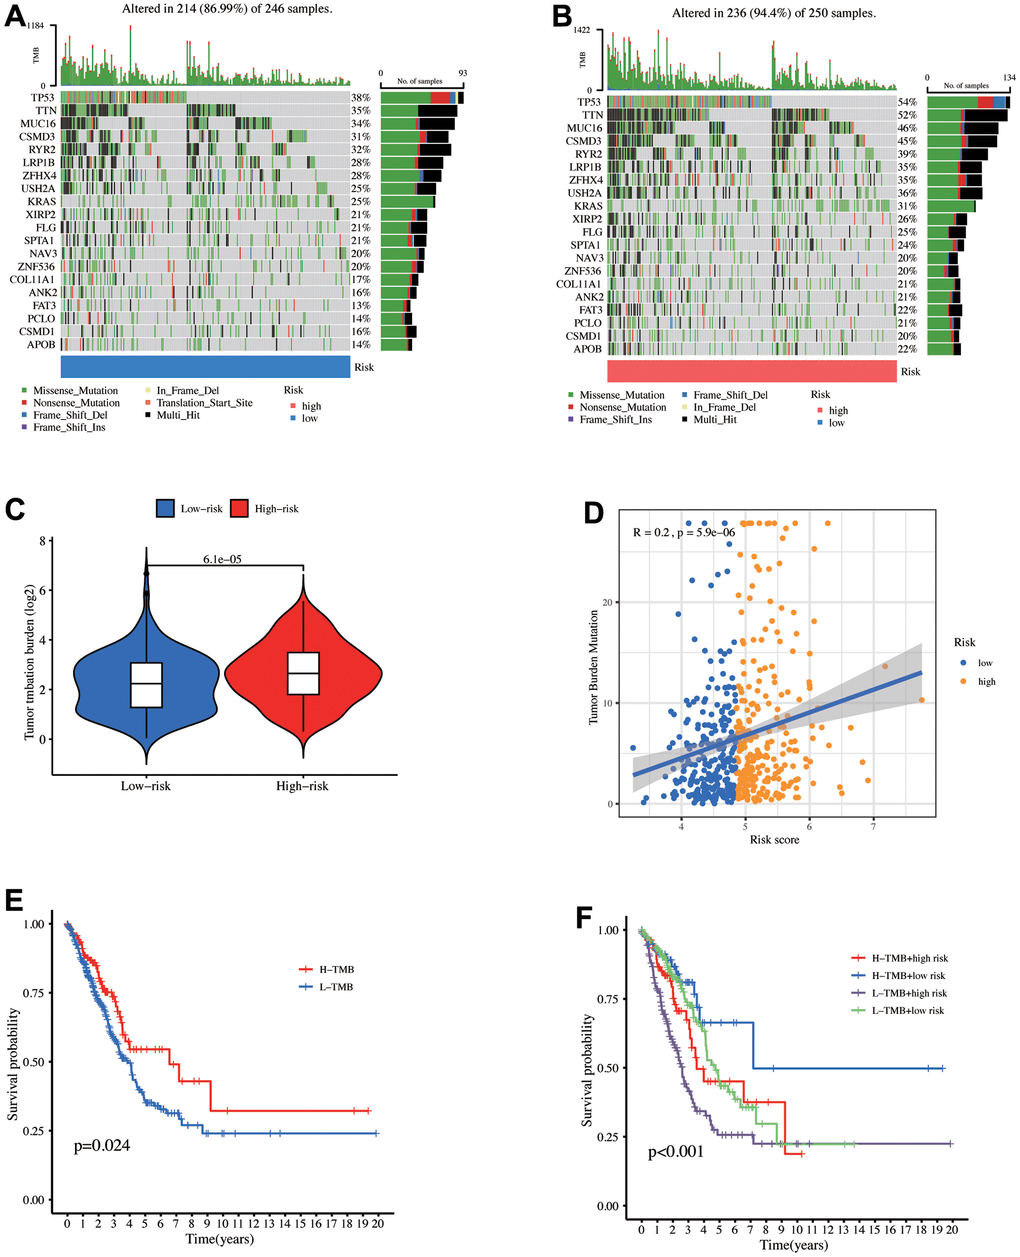
Figure 6.Mutation analysis between the high- and low-risk groups. The mutational landscapes of the (A) high- and (B) low-risk groups. (C) TMB level comparison between high- and low-risk groups. (D) Correlation between risk score and TMB. (E) K-M curves for high and low TMB levels. (F) K-M curves for the patients stratified by risk score and TMB.