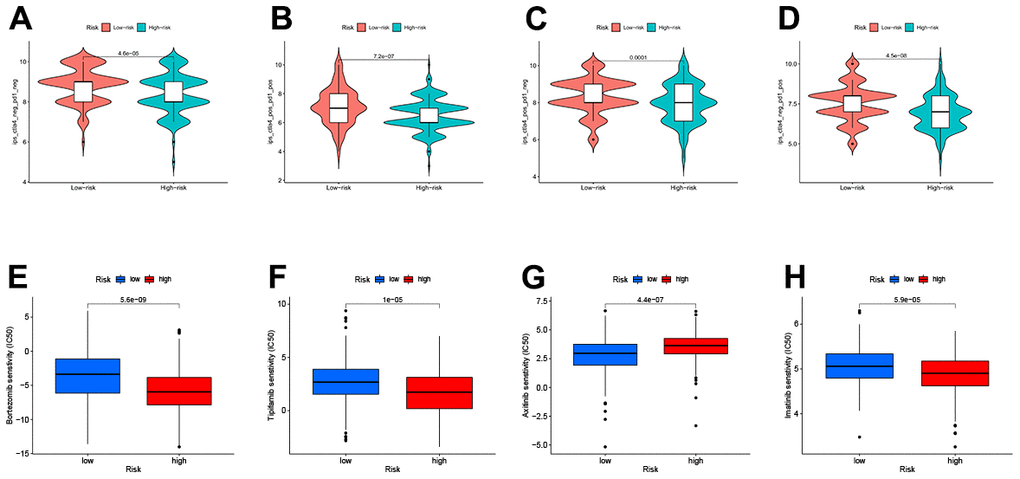
Figure 8.Relationship between TEXPM and (IPS) analysis and drug sensitivity (A–D) low-TEXPM and high-TEXPM response to IPS. (E–H) Treatment of different small molecule drugs by high and low-TEXPM groups.
Figure 8 — Construction of a T-cell exhaustion-related gene signature for predicting prognosis and immune response in hepatocellular carcinoma | Aging