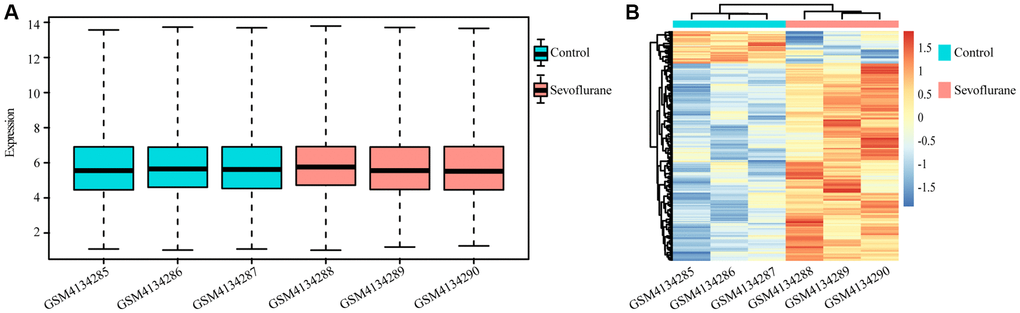
Figure 1.Differentially regulated genes between the control and sevoflurane-treated groups. (A) Boxplot of all genes in each sample. (B) Heatmap of differentially regulated genes in the control and sevoflurane-treated groups, 194 upregulated and 32 downregulated genes after treatment with 2.5% sevoflurane in 100% oxygen for 4 hours. (Green: Control group; Red: sevoflurane-treated group).