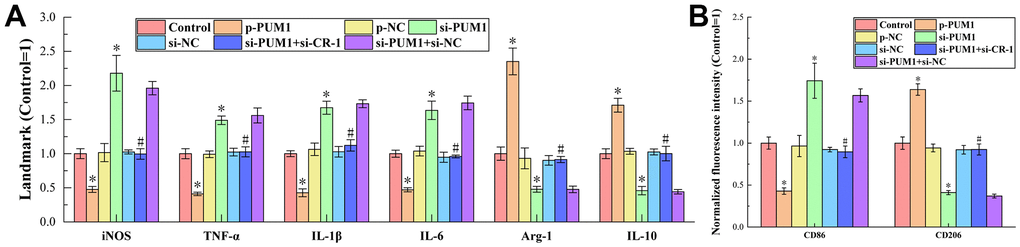
Figure 5.(A) The results of ELISA detection. The specific values were: 4.21 ± 0.31 U/L (iNOS), 769.18 ± 56.63 ng/L (TNF-α), 107.25 ± 4.66 ng/L (IL-1β), 100.43 ± 5.16 pg/mL (IL-6), 7.50 ± 0.73 U/L (Arg-1), 623.92 ± 44.92 pg/ mL (IL-10). (B) The results of flow cytometry detection. The symbol * means p < 0.05 compared to Control group. The symbol # means p < 0.05 compared to si-PUM1 group.