Submit an Article
Navigate
Home
Editorial Board
Editorial Policies
Current Volume
Archive
Scientific Integrity
Publication Ethics Statements
Interviews with Outstanding Authors
Newsroom
Sponsored Conferences
Podcast
Contact
Special Collections
Submit an Article
Online ISSN: 1945-4589
Research Paper
|
Volume 15, Issue 14
|
pp. 6736–6748
Establishing a prognostic model based on five starvation-related long non-coding RNAs for clear cell renal cell carcinoma
Back to article
Figure 3
(3 of 9)
−
100%
+
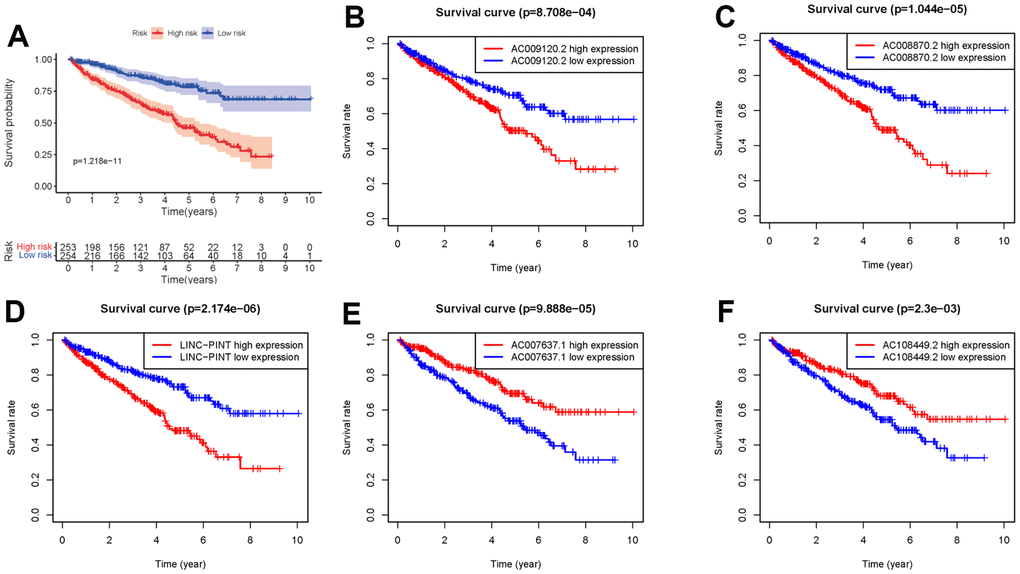
Figure 3.
Kaplan-Meier survival curve of SRSM.
Kaplan-Meier survival curve of the high-risk group and low-risk group in SRSM (
A
). The survival curves of sSR-LncRs (AC009120.2, AC008870.2, LINC-PINT, AC007637.1, and AC108449.2) (
B
–
F
).