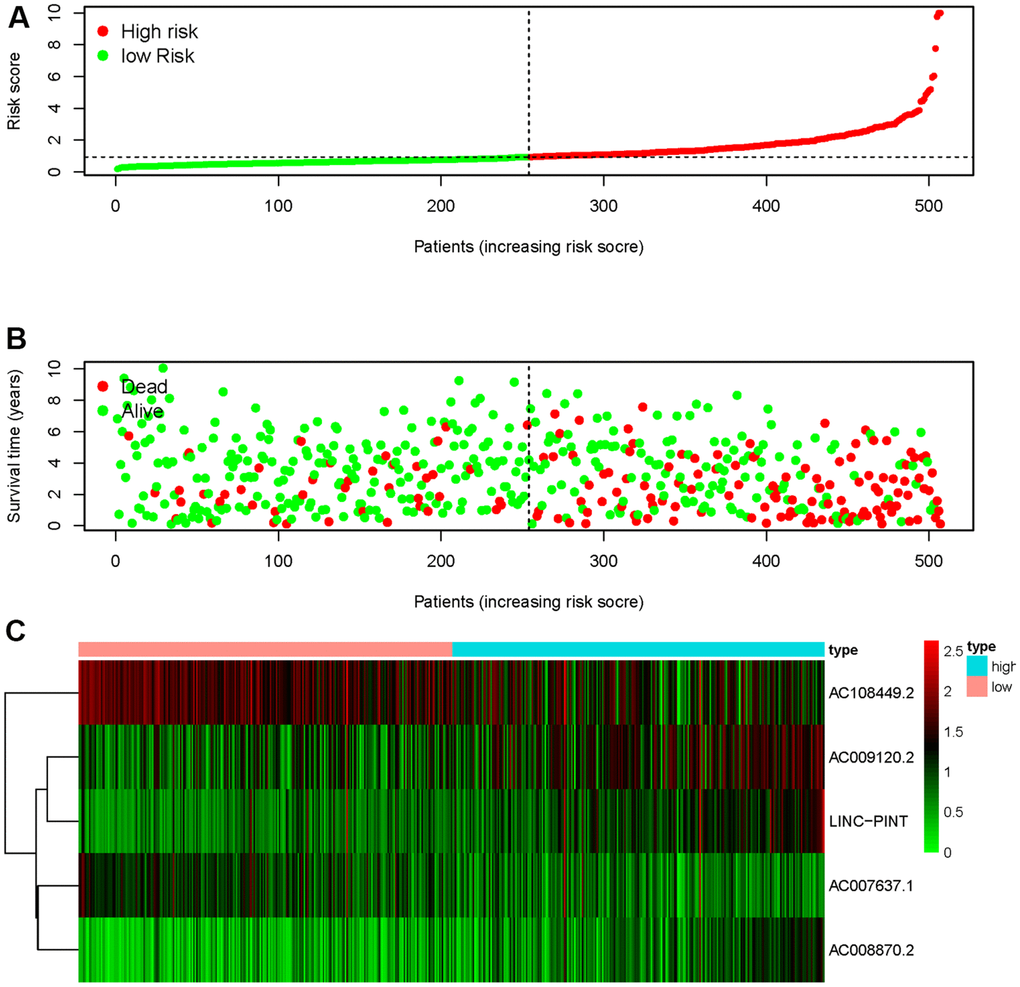
Figure 2.Starvation-related risk score model. The risk score of SRSM and the low-risk group was distributed on the left side by the median risk score (A). The survival status of ccRCC patients with the value of different risk scores (B). The heatmap of expressions of LINC-PINT, AC008870.2, AC108449.2, AC009120.2 and AC007637.1 in the SRSM (C).