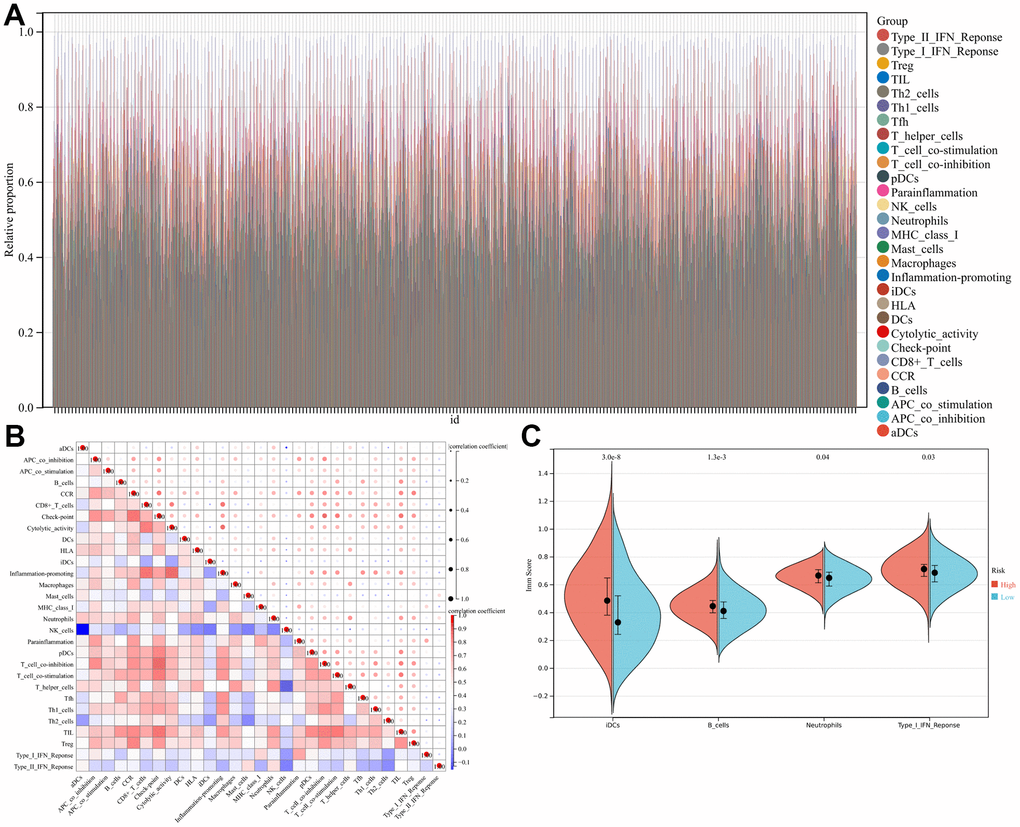
Figure 4.Landscape of immune cell infiltration in high- and low-risk lung adenocarcinoma (LUAD) patients. (A) Relative proportion of immune cell infiltration in high- and low-risk LUAD patients. (B) Correlation matrix of all 29 immune cell proportions. (C) Violin plots illustrating immune cells at significant proportions between high-risk and low-risk patients.