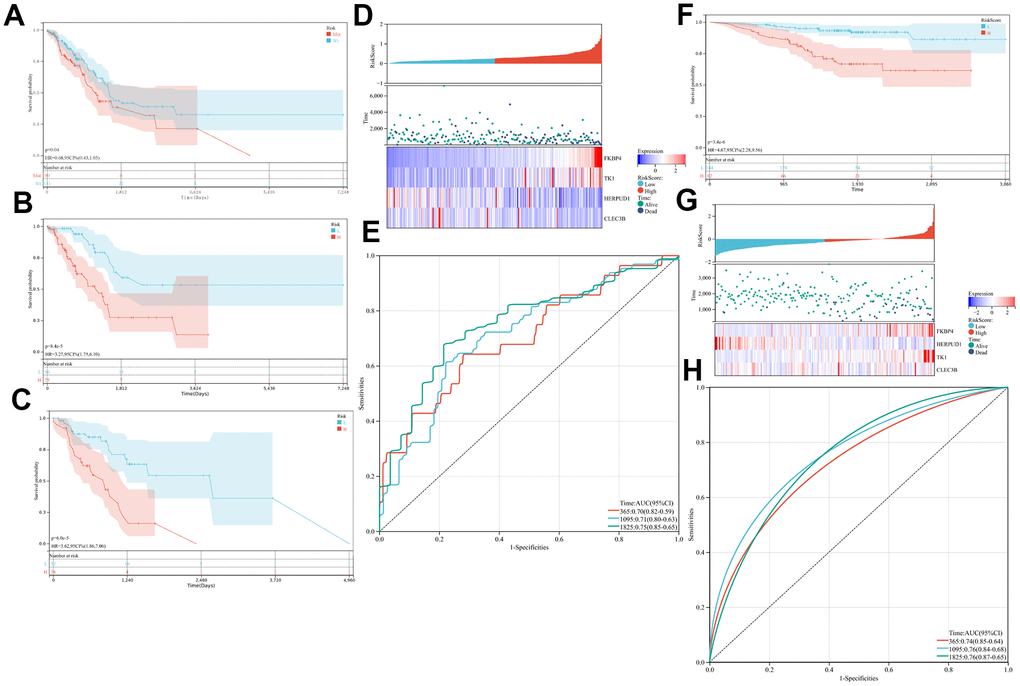
Figure 3.Prognostic analysis of the immune prognostic model (IPM). Kaplan-Meier curves of the difference in overall survival (OS) between high- and low-risk cases in (A–F) the whole The Cancer Genome Atlas (TCGA) and Gene Expression Omnibus (GEO) cohorts, (B) mucin 16 wild-type (MUC16WT) subgroup, and (C) mucin 16 mutation (MUC16MUT) subgroup. (D–G) Relationship between risk score (upper) and expression of two prognostic immune genes (bottom). (E–H) Time-dependent receiver operating characteristic (ROC) curve analysis of the IPM.