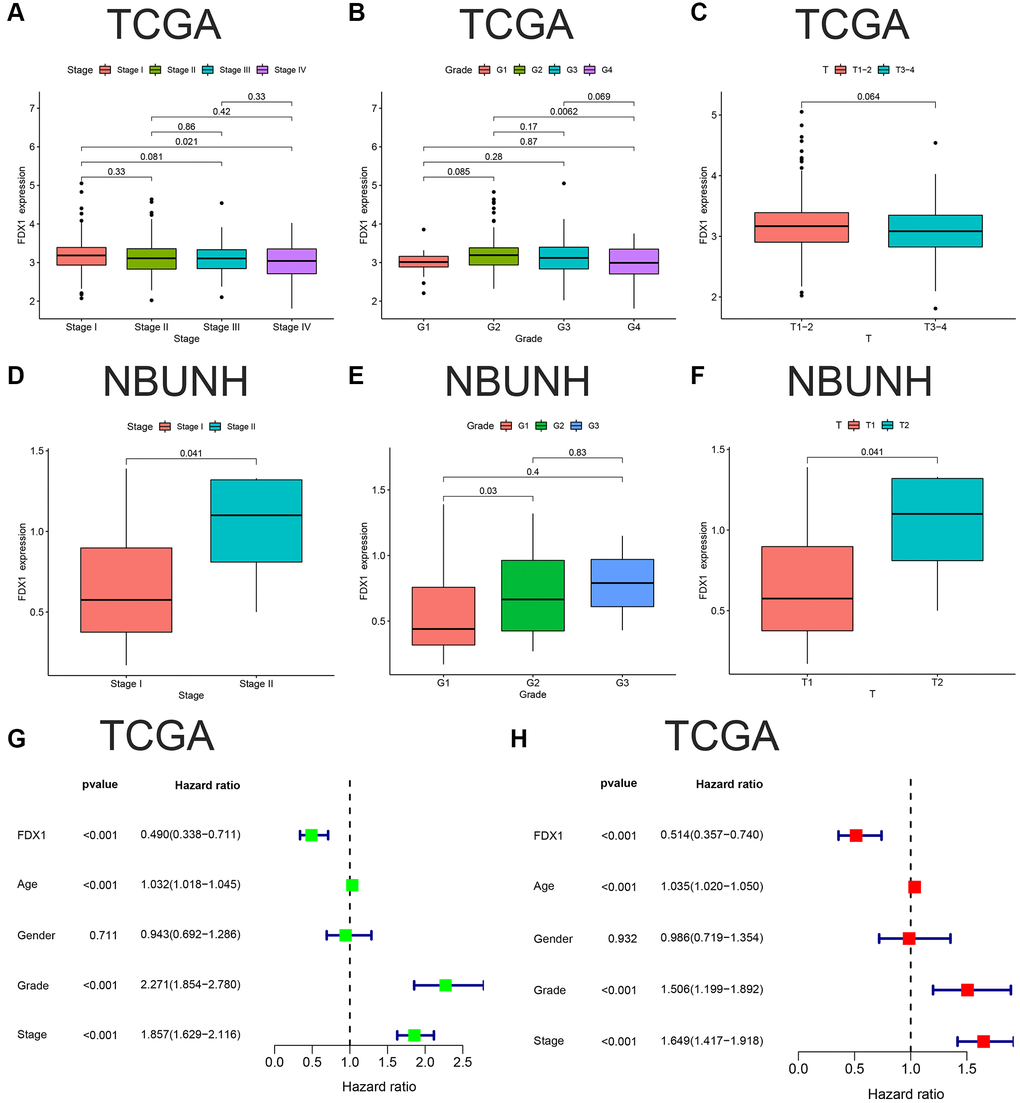
Figure 5.Clinical correlation and independent prognostic analyses of FDX1. (A–C) Associations between FDX1 and Stage, Grade, Stage T in TCGA database. (D–F) Association between FDX1 and Stage, Grade, Stage T in the NBUNH cohort. (G, H) Univariate and multivariate Cox regression analyses of clinicopathological variables and FDX1 in ccRCC.