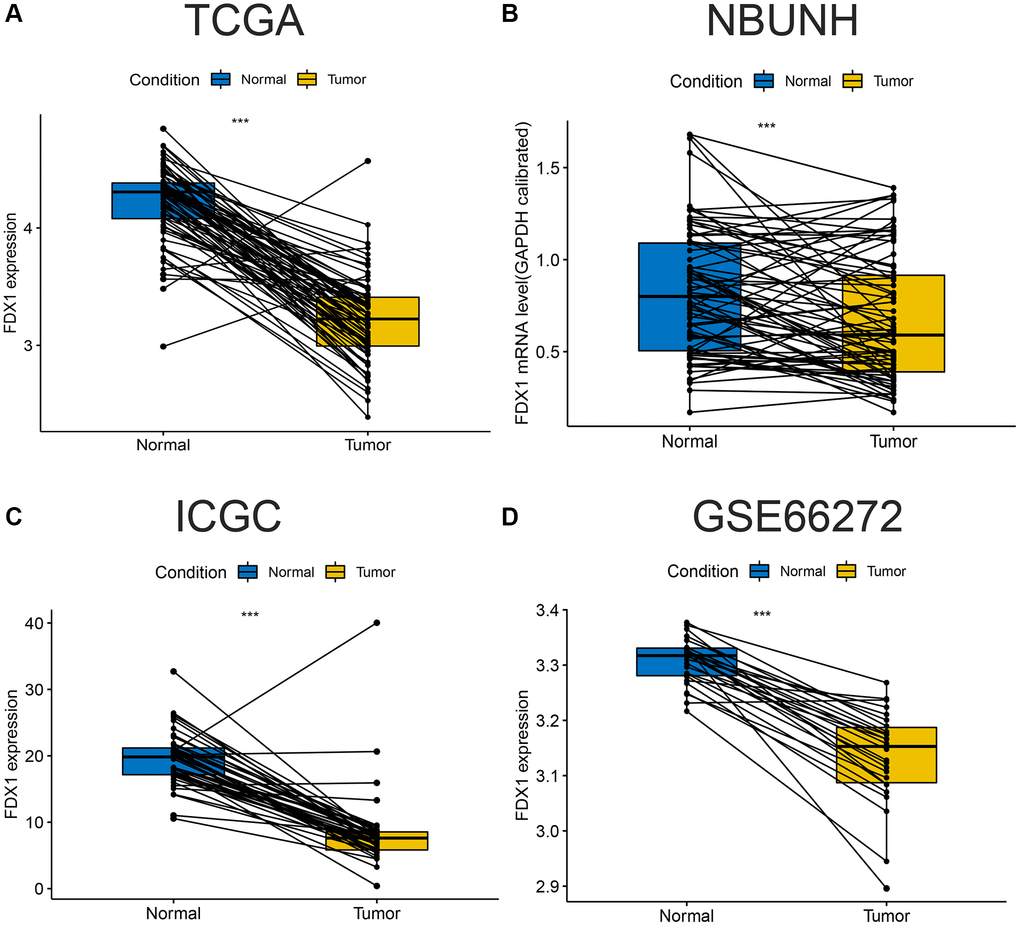
Figure 2.Comparison of paired FDX1 mRNA expression levels in ccRCC. (A) Boxplot of paired FDX1 expression levels in TCGA dataset (KIRC) (N = 72, T = 72). (B) Boxplot of paired FDX1 expression levels in the NBUNH dataset (N = 75, T = 75). (C) Boxplot of paired FDX1 expression levels in the ICGC dataset (RECA-EU) (N = 45, T = 45). (D) Boxplot of paired FDX1 expression levels in the GEO dataset (GSE66272) (N = 25, T = 25).