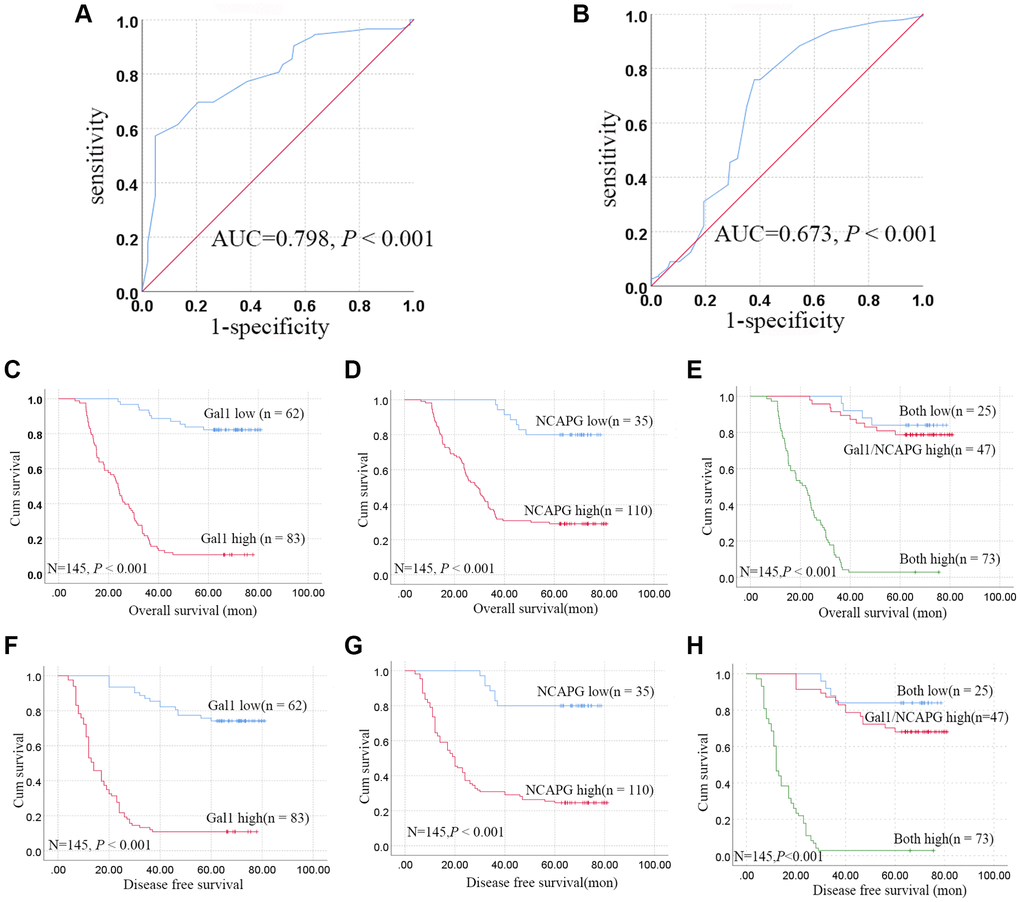
Figure 2.Aberrant Gal1 and NCAPG expression in GC tissues indicates poor prognosis. (A, B) Receiver operating characteristic statistics were employed to estimate the cut-off points of the IRS for (A) Gal1 and (B) NCAPG in GC tissues. (C–E) Kaplan-Meier curves for Gal1, NCAPG, and combined Gal1/NCAPG expression in the training cohort for overall survival. (F–H) Kaplan-Meier curves for Gal1, NCAPG, and combined Gal1/NCAPG expression in the training cohort for disease free survival.