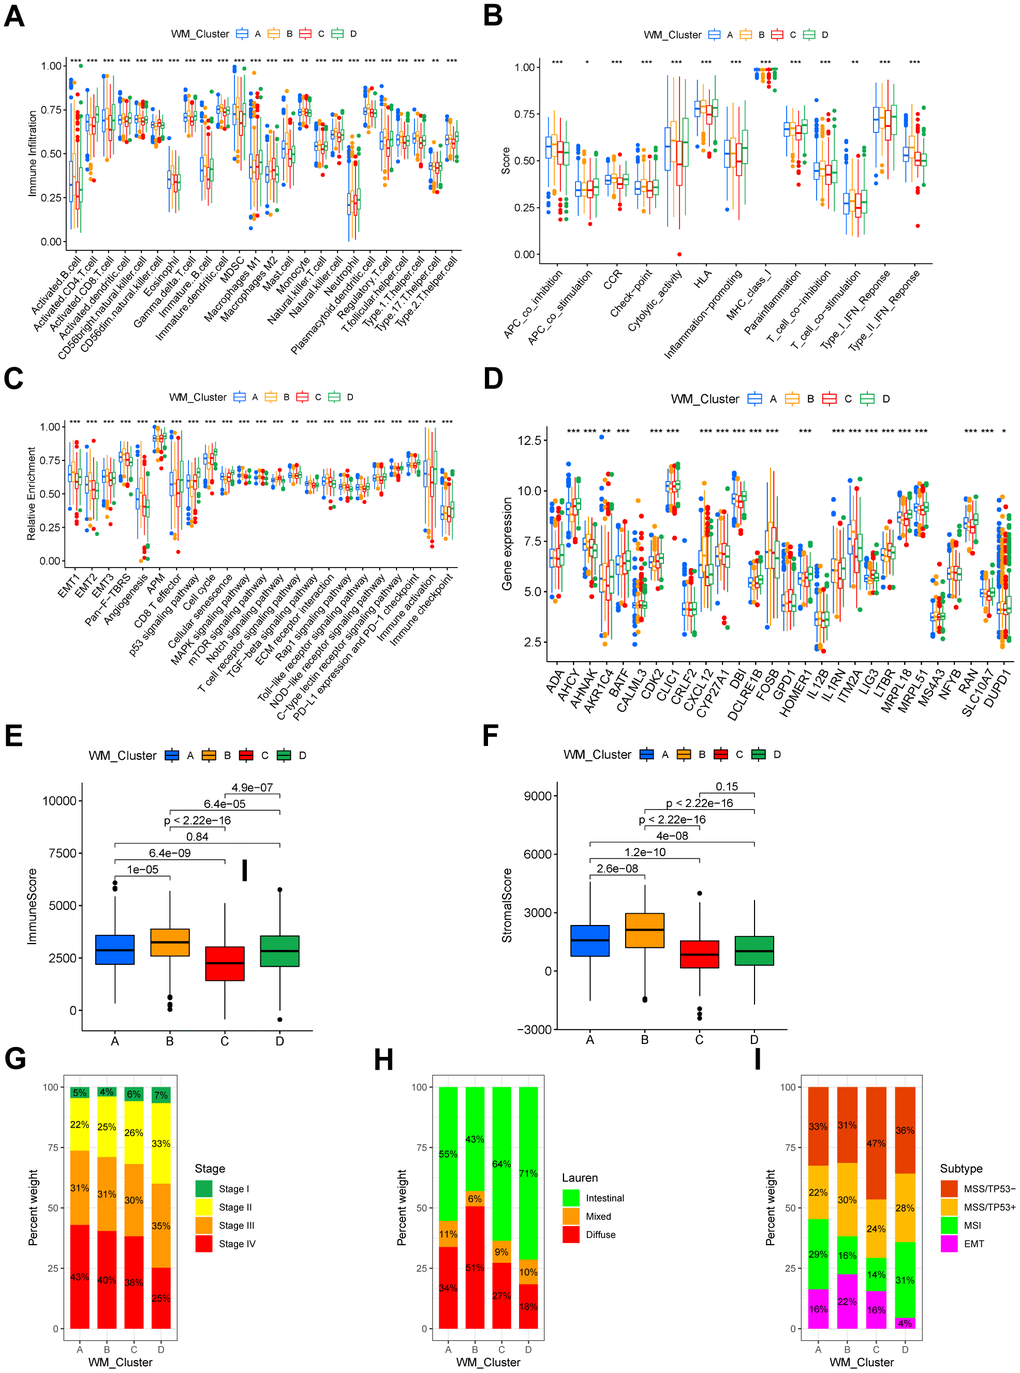
Figure 3.TME characteristics and clinical features of distinct RNA modification patterns. (A) Relative abundance of 24 TME infiltrating cells in four RNA modification patterns. Names of the infiltrating cells are listed at the bottom of the chart. (B) Score of functions in immune regulation of four RNA modification patterns. Immune functions are listed. (C) Relative enrichment of stromal-related, immune-related and tumor-related pathways of the four RNA modification patterns. Pathway names are listed below. (D) Expression of T cell function enhancers. Gene names of these enhancers are listed. In both the box plots of (A–D), the color of WM_Cluster A is blue, WM_Cluster B is orange, WM_Cluster C is red, and WM_Cluster D is green. The upper and lower ends of the boxes represent an interquartile range of values. Lines in the boxes represent the median value. Four colors of the dots are outliers. Asterisks above the boxes represent the statistical p-value (*P < 0.05; **P < 0.01; ***P < 0.001). (E) Immune score and (F) stromal score of four types of RNA modification patterns. P < 0.05 in the Kruskal-Wallis test was regarded as statistically significant. (G–I) Bar plots showing RNA modification patterns in different clinical stages (G), ACRG molecular subtypes (H), and Lauren subtypes (I).