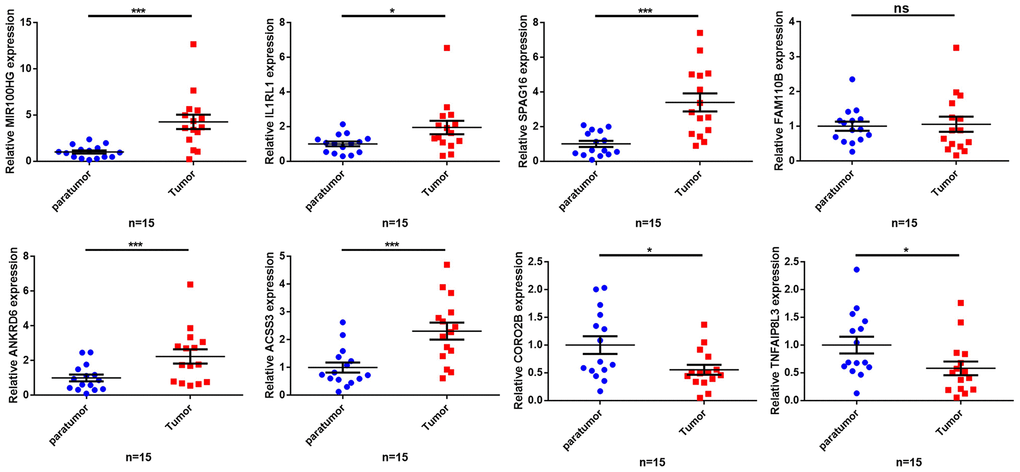
Figure 8.Validation of the expression of key genes in human tissues. The qRT-PCR results showing expression level of the 8 key genes. *p< 0.05, **p < 0.01, ***p < 0.001, ns: no significant difference.
Figure 8 — Identification of a novel MSI-related ceRNA network for predicting the prognosis and immunotherapy response of gastric cancer | Aging