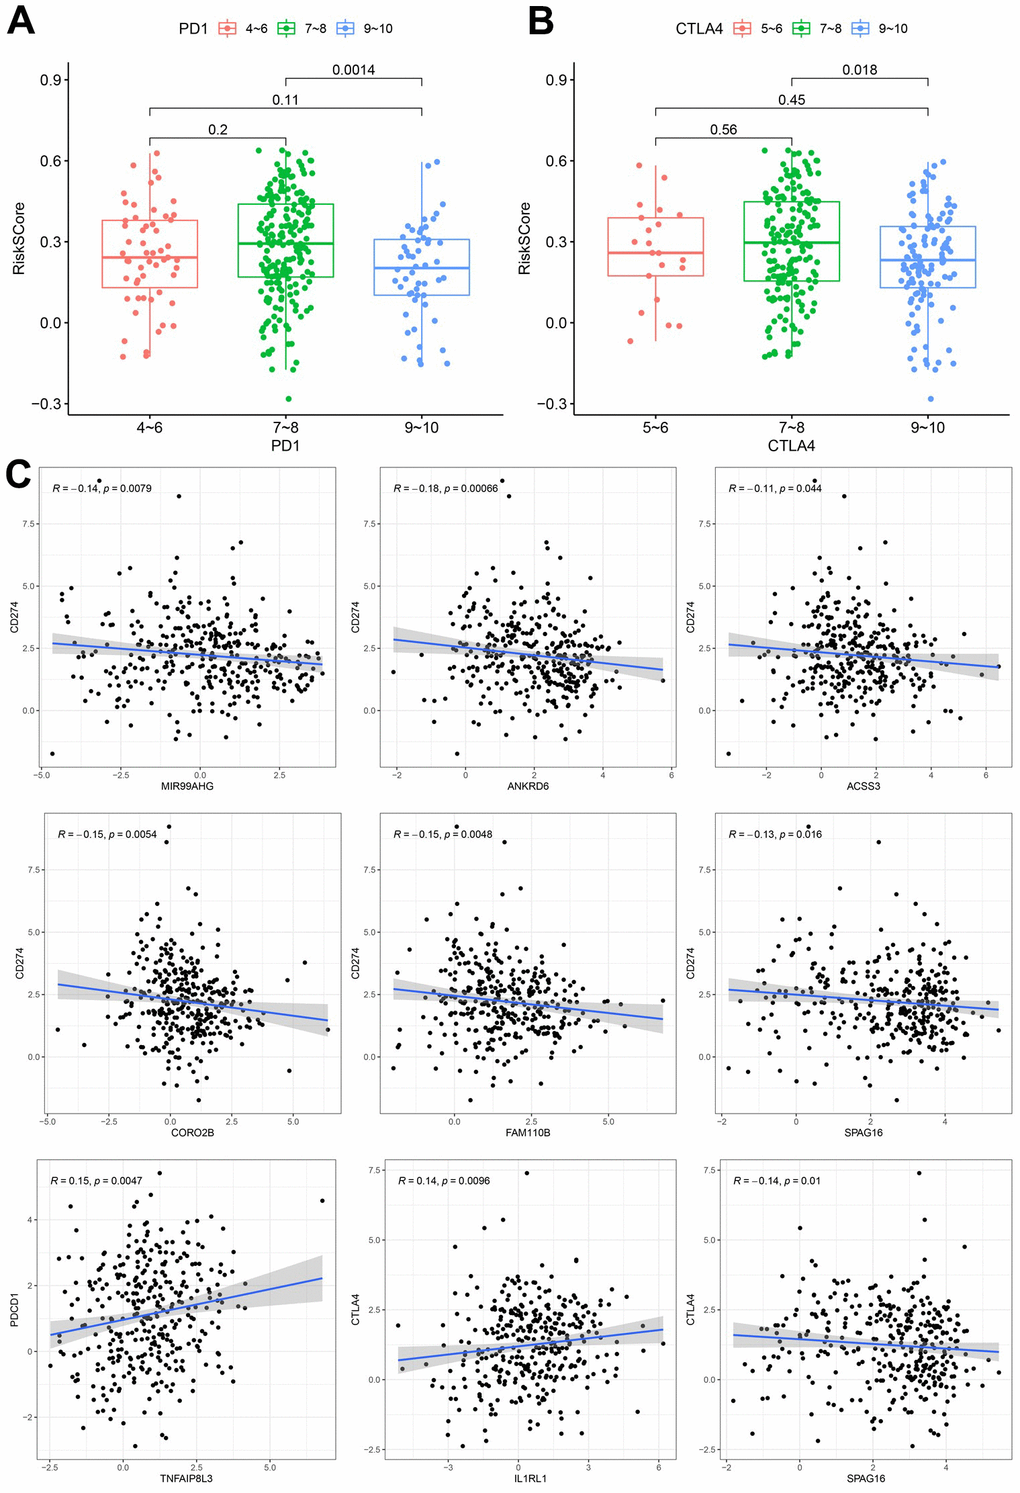
Figure 6.Correlation between the constructed model and ICI. (A) Analysis of risk scores among different IPS-PD1/PDL1/PDL2 groups. (B) Comparation of risk scores in the indicated IPS-CTLA4 groups. (C) Expression correlation between hub nodes and immune checkpoint.