Submit an Article
Navigate
Home
Editorial Board
Editorial Policies
Current Volume
Archive
Scientific Integrity
Publication Ethics Statements
Interviews with Outstanding Authors
Newsroom
Sponsored Conferences
Podcast
Contact
Special Collections
Submit an Article
Online ISSN: 1945-4589
Research Paper
|
Volume 15, Issue 11
|
pp. 5125–5143
Network pharmacology-based research on the effect of angelicin on osteosarcoma and the underlying mechanism
Back to article
Figure 7
(7 of 12)
−
100%
+
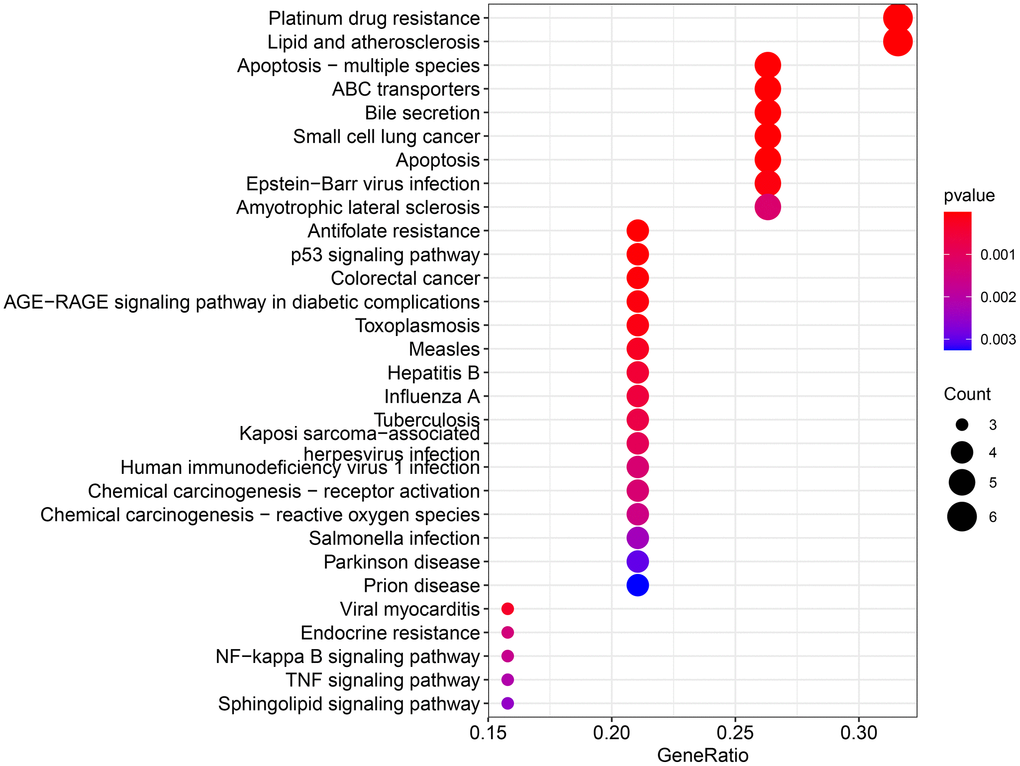
Figure 7.
KEGG enrichment analysis for therapeutic targets.
The larger the bubble, the more targets are enriched in that pathway, and the redder the color; the smaller the
P
value, the more meaningful the corresponding signaling pathway.