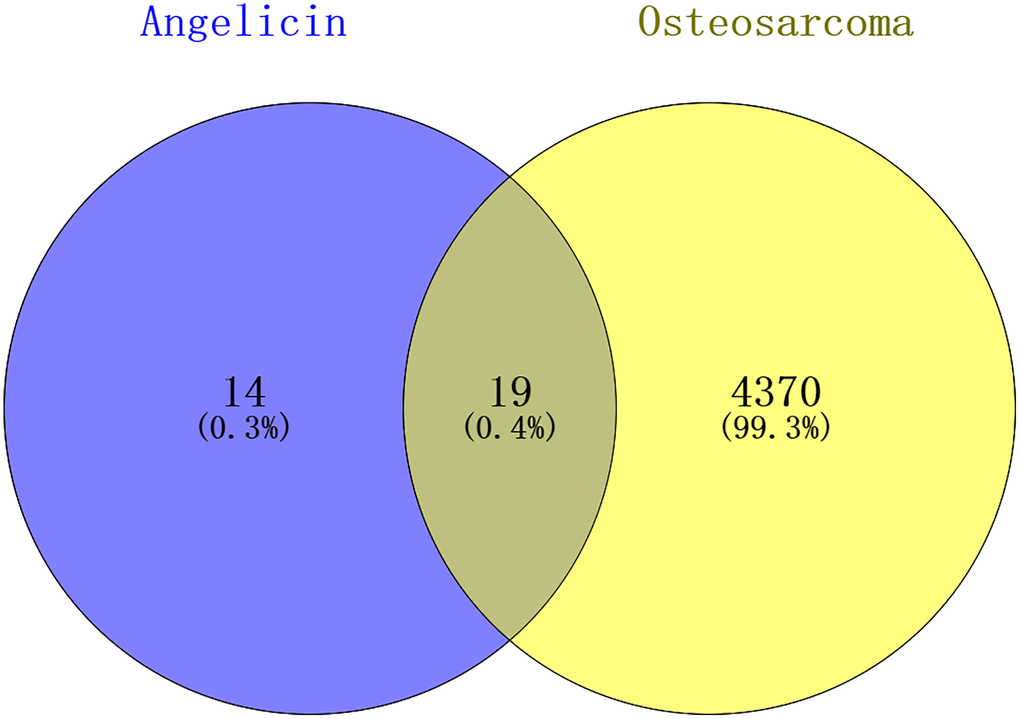
Figure 2.Venn diagram showing the intersection of angelicin-related genes and osteosarcoma-related genes. The angelicin-related targets are shown in the blue circle, and the osteosarcoma-related targets are shown in the yellow circle. The intersection of the two circles indicates potential targets of angelicin in osteosarcoma treatment.