Submit an Article
Navigate
Home
Editorial Board
Editorial Policies
Current Volume
Archive
Scientific Integrity
Publication Ethics Statements
Interviews with Outstanding Authors
Newsroom
Sponsored Conferences
Podcast
Contact
Special Collections
Submit an Article
Online ISSN: 1945-4589
Research Paper
|
Volume 15, Issue 11
|
pp. 5096–5124
Pan-cancer analysis of Homeobox B9 as a predictor for prognosis and immunotherapy in human tumors
Back to article
Figure 6
(6 of 10)
−
100%
+
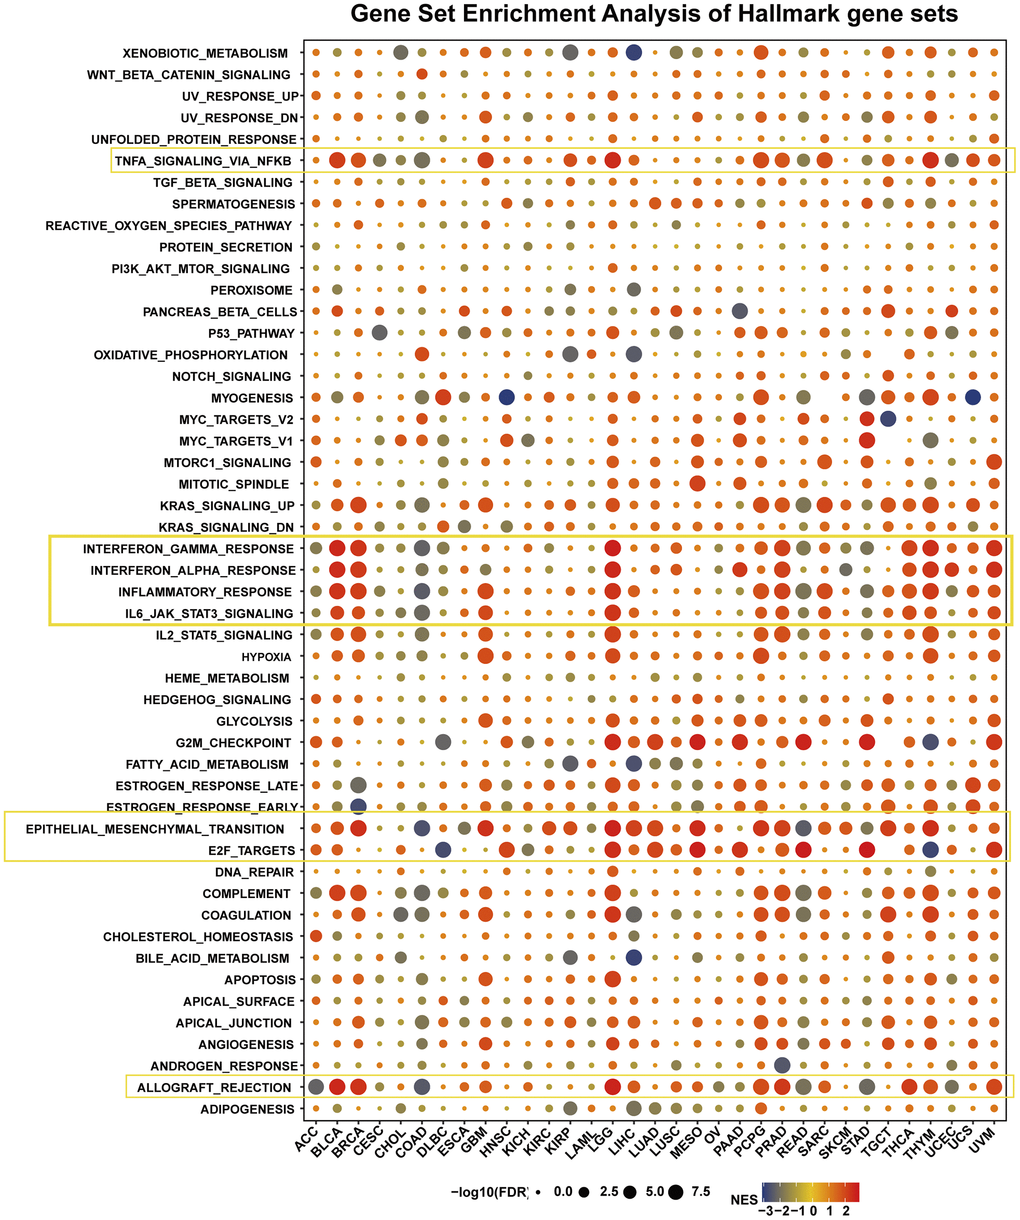
Figure 6.
The hallmarks gene set enrichment analysis of HOXB9 in cancers.
The circle size represents the FDR value of the enriching term in each tumor.