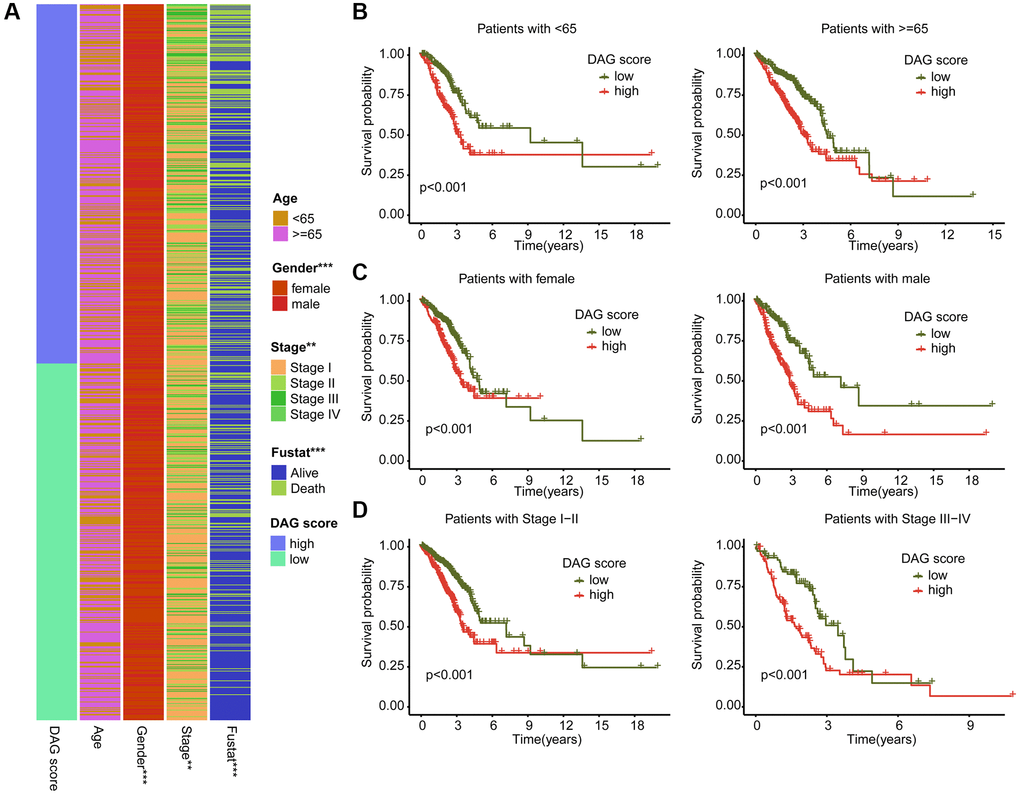
Figure 7.Association analysis of DAG score and clinical variables. (A) Heatmap diagram shows the DAG score distribution in the different clinicopathological characteristics. (B–D) Clinical prognosis analysis of LUAD samples with low- and high DAG score among age, gender and stage.