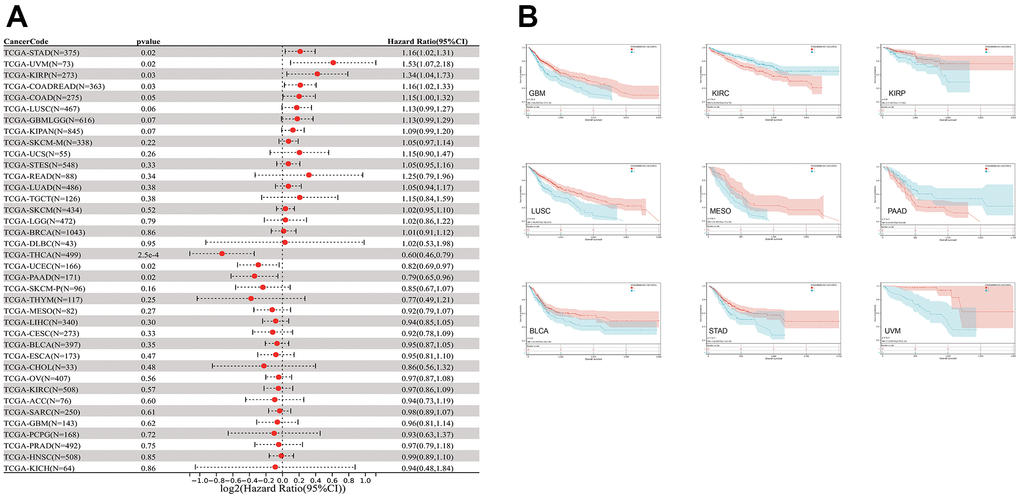
Figure 3.The relationship between CLDN5 expression and cancer patients' OS. (A) A forest plot of CLDN5 hazard ratios in 33 multiple cancers. (B) Kaplan-Meier survival curves of OS for patients groups defined by CLDN5 expression in GBM, KIRP, COADREAD, STAD, KIRC, LUSC, BLCA, MESO, UVM, PAAD, PCPG, and KICH.