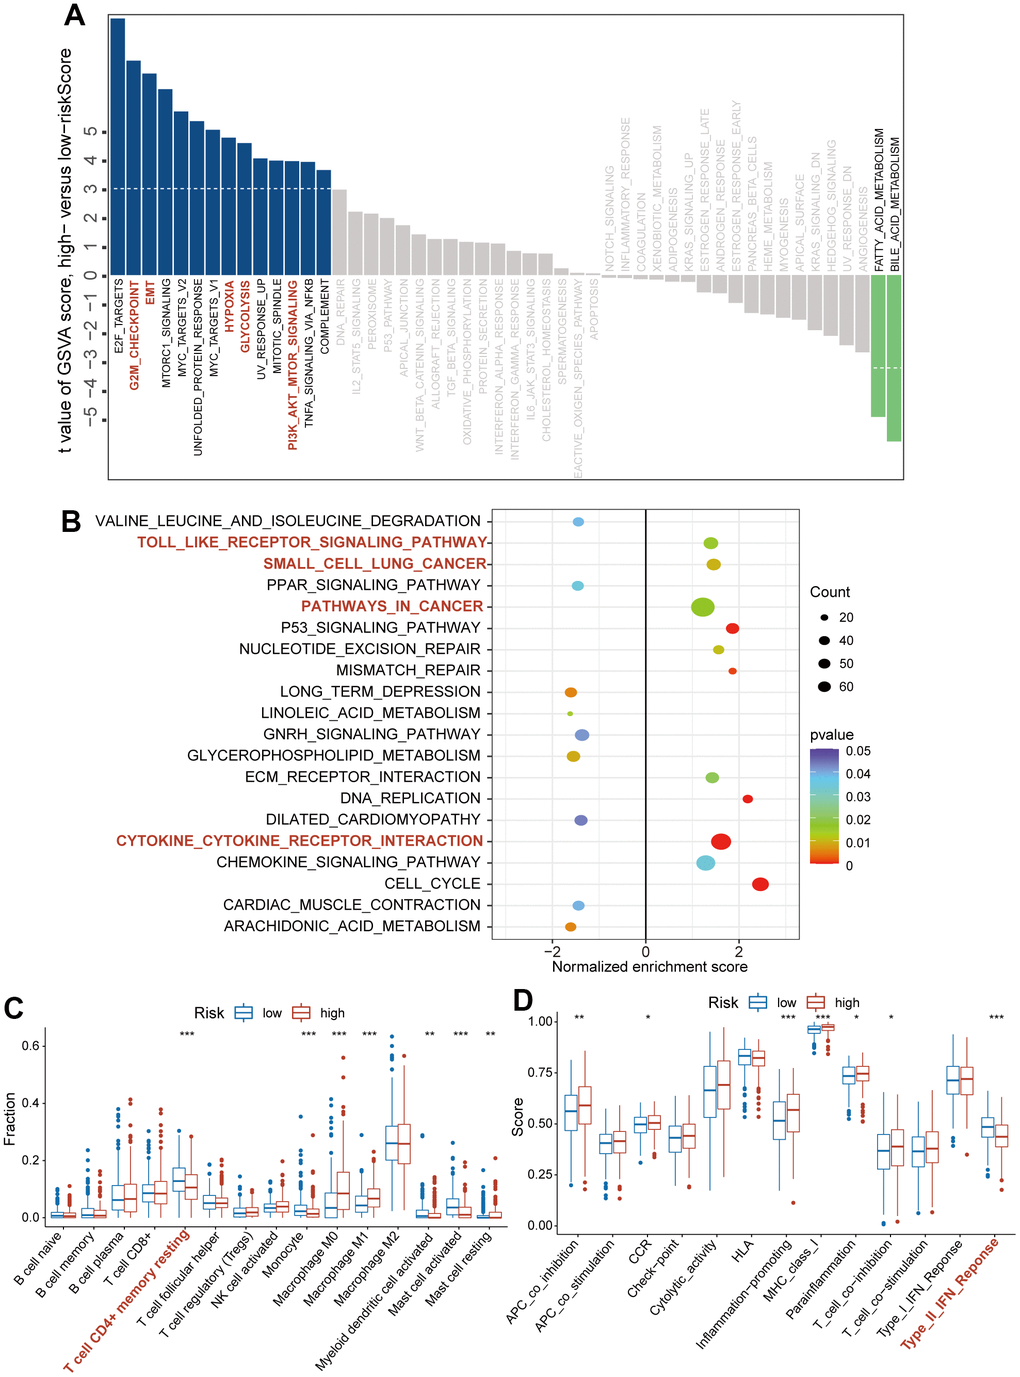
Figure 5.The association of CAFs-related risk signature (CAFRS) with oncogenic pathways and immune cells/functions. (A) The bar plots showing the GSVA scores of hallmark pathways (Fifty items) between the low- and high-risk subgroups. Red bar plots represent activated pathways in the high-risk subgroup. (B) The bubble plot indicating the activated and repressed pathways between low- and high-risk subgroup, referring to the KEGG gene set. (C) The fraction of tumor infiltrating immune cells between low- and high-risk subgroups (D) Immune function scores between low- and high-risk subgroup. (*P < 0.05, **P < 0.01, ***P < 0.001).