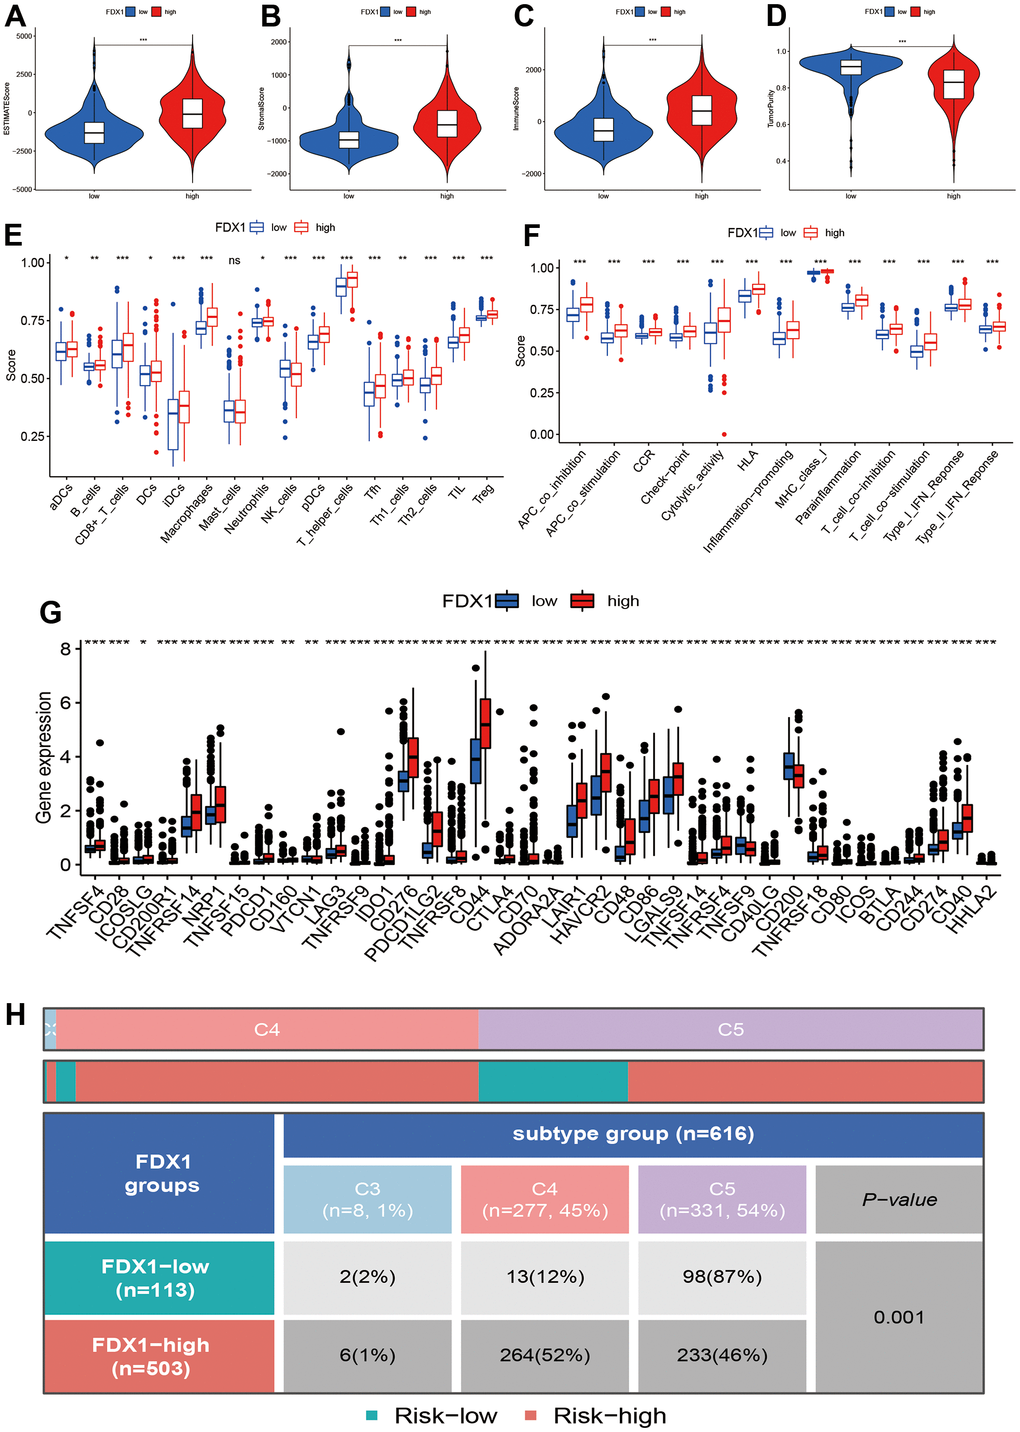
Figure 5.Correlation of FDX1 expression with immune status. (A–D) Association between FDX1 expression and ESTIMATE, stromal, and immune scores and tumor purity. (E, F) Immune cell infiltration levels and immune-related function in high- and low-FDX1 expression groups. (G) Differences in expression of immune checkpoint genes between high- and low- FDX1 expression groups. (H) Correlation between FDX1 and immune subtypes.