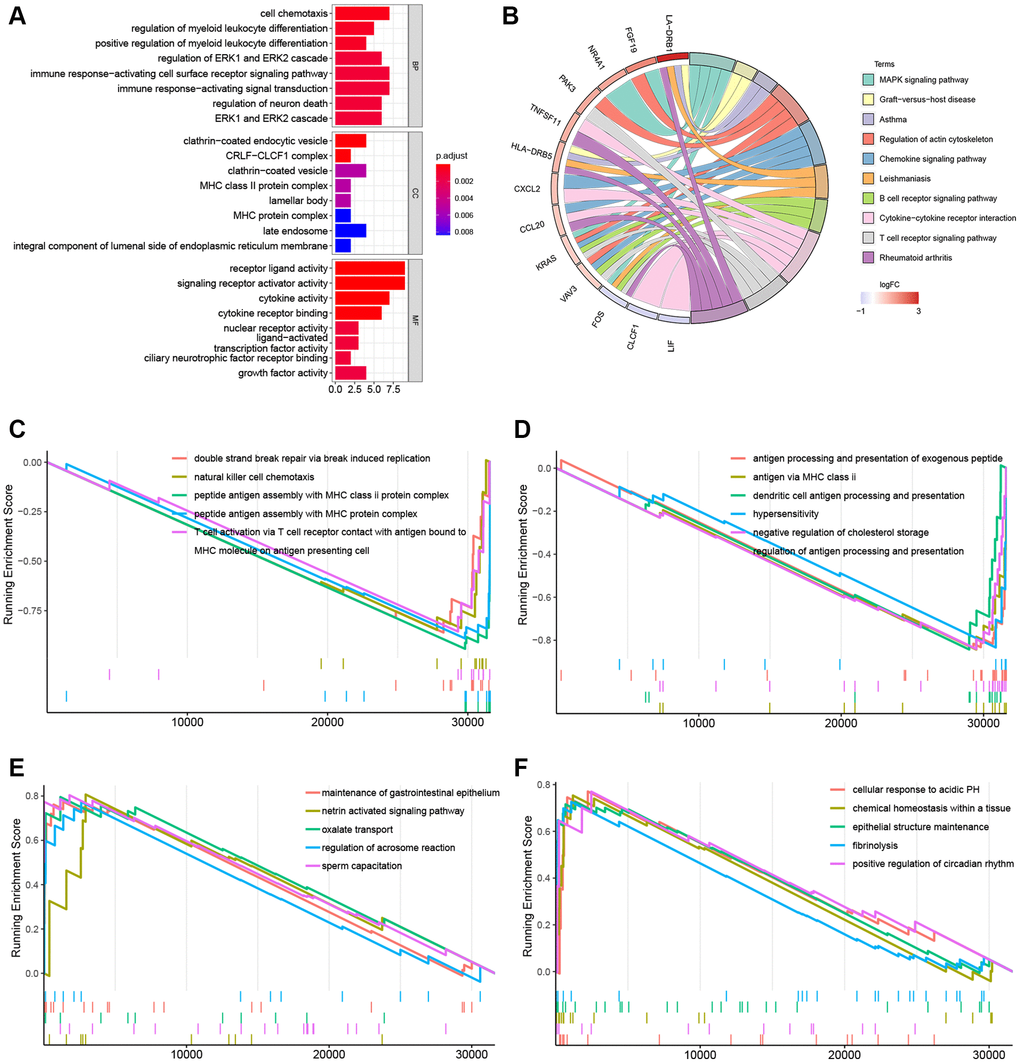
Figure 4.Gene function enrichment analyses and GSEA plots. (A) Barplot of the GO terms. (B) Circle plot of the top 10 KEGG pathways. (C, D) GSEA plots of the suppressed KEGG pathways in the KRAS-mutated group. (E, F) GSEA plots of the activated KEGG pathways in the KRAS-mutated group.