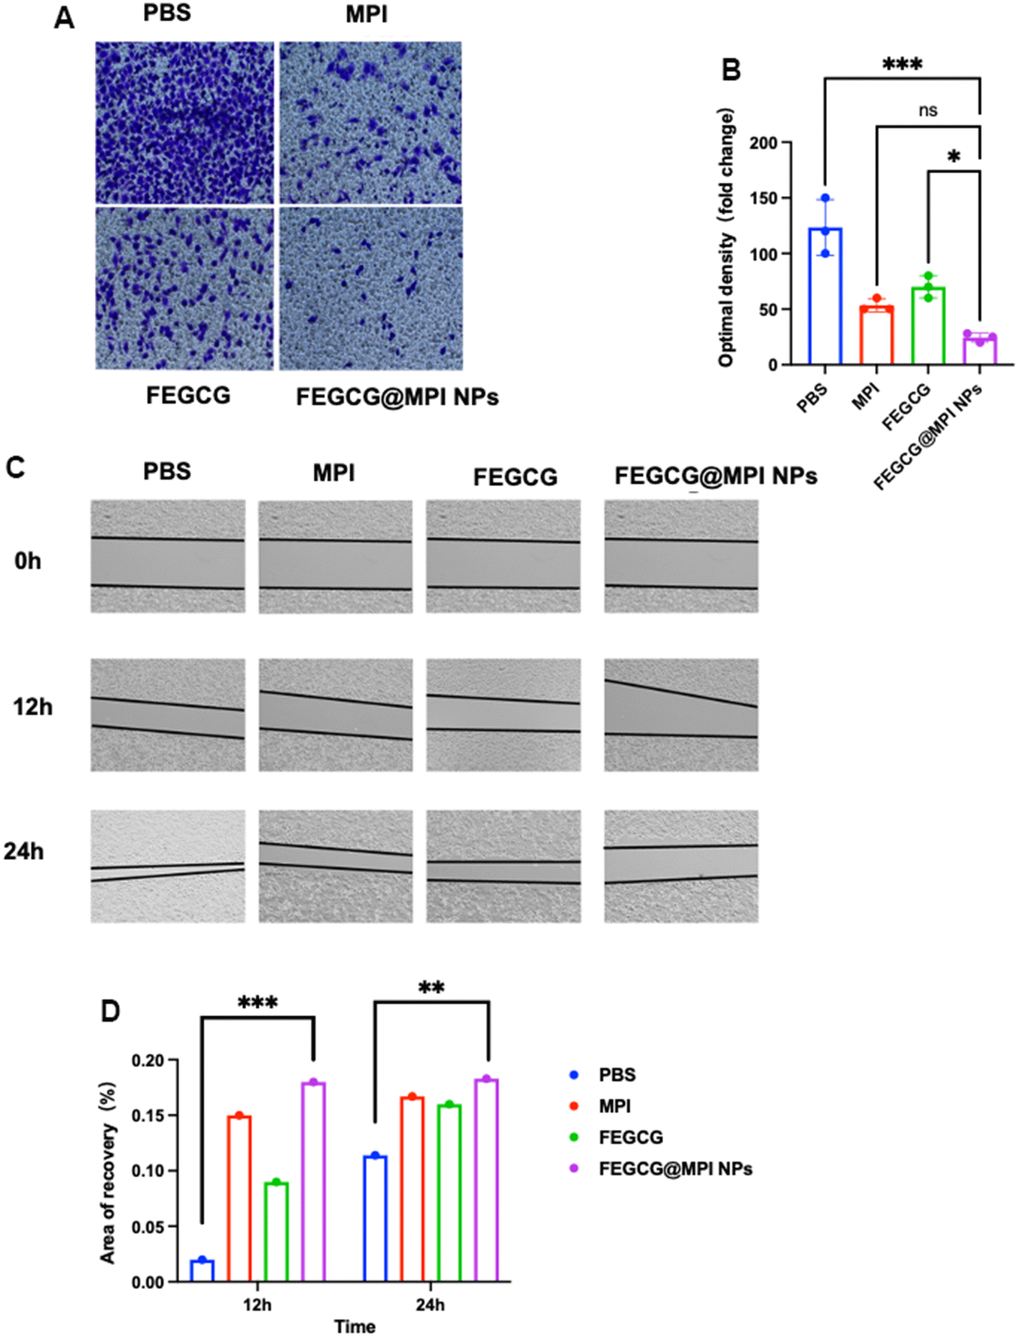
Figure 4.Effect of FEGCG@MPI NPs on invasion and migration of Hep 3B cells. (A) Invasion of Hep3B cells treated with PBS, MPI, FEGCG, FEGCG@MPI NPs. The FEGCG@MPI NPs group had significantly less cell migration than the PBS, MPI and FEGCG groups. (B) Data are presented as the mean ± standard deviation. *P < 0.05 vs MPI or FEGCG, **P < 0.01 vs MPI or FEGCG. (C) Scratch of Hep3B cells treated with PBS, FEGCG, MPI, FEGCG@MPI NPs for 0, 12 and 24 hours respectively. (D) Data are presented as the mean ± standard deviation. *P < 0.05, **P < 0.01 by an unpaired two-tailed Student's t-test (two groups) or one-way analysis of variance (ANOVA) with Turkey's multiple comparisons (three groups).