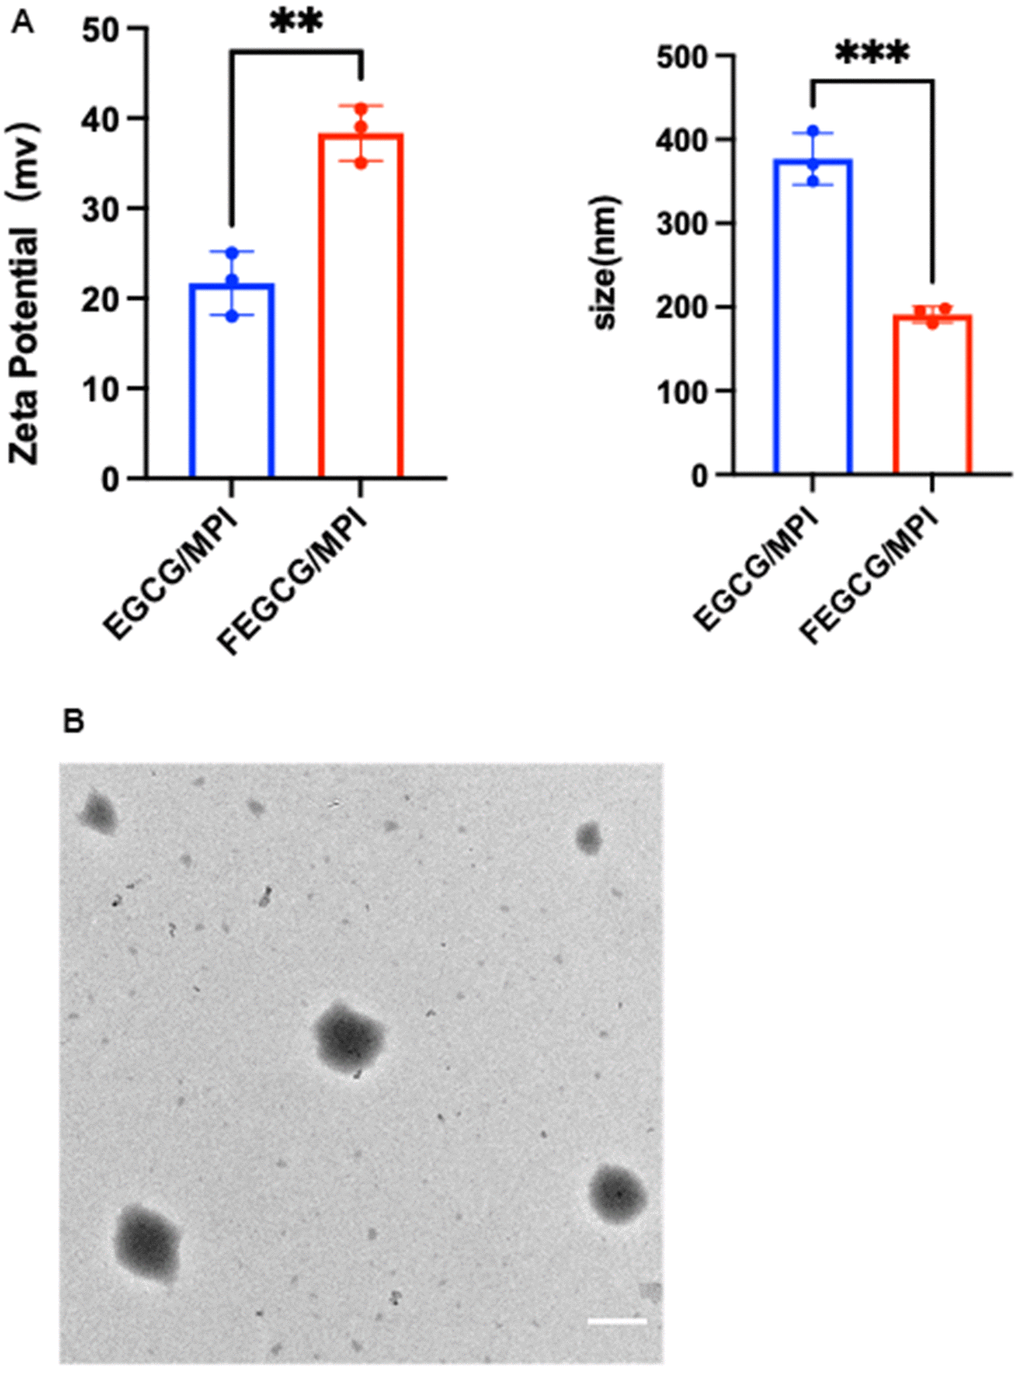
Figure 1.Characterization of FEGCG@MPI NPs. (A) Size contribution of FEGCG@MPI NPs, and EGCG@MPI NPs. Zeta potential of FEGCG@MPI NPs, and EGCG@MPI NPs. (B) TEM images of FEGCG@MPI NPs. Scale bar = 100nm.
Figure 1 — Co-delivery of EGCG and melittin with self-assembled fluoro-nanoparticles for enhanced cancer therapy | Aging