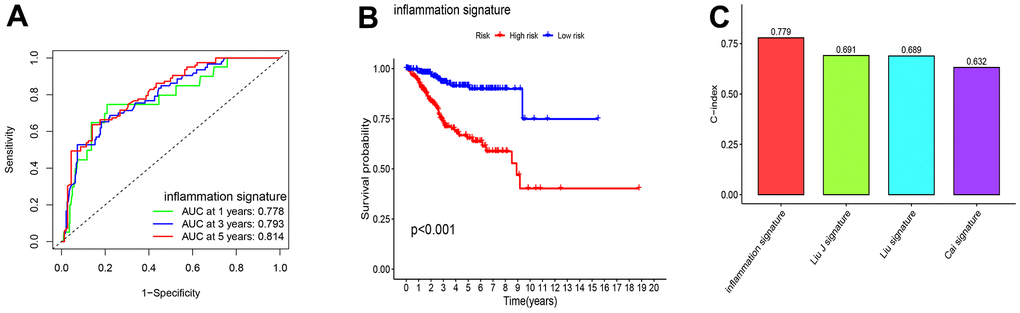
Figure 3.The comparison between model for IRGs and the existing model for signatures. (A, B) Survival curves and ROC curves of high and low risk groups in the model constructed by us. (C) C-index comparison of inflammatory models with other models.
Figure 3 — A novel predictive model based on inflammatory response-related genes for predicting endometrial cancer prognosis and its experimental validation | Aging