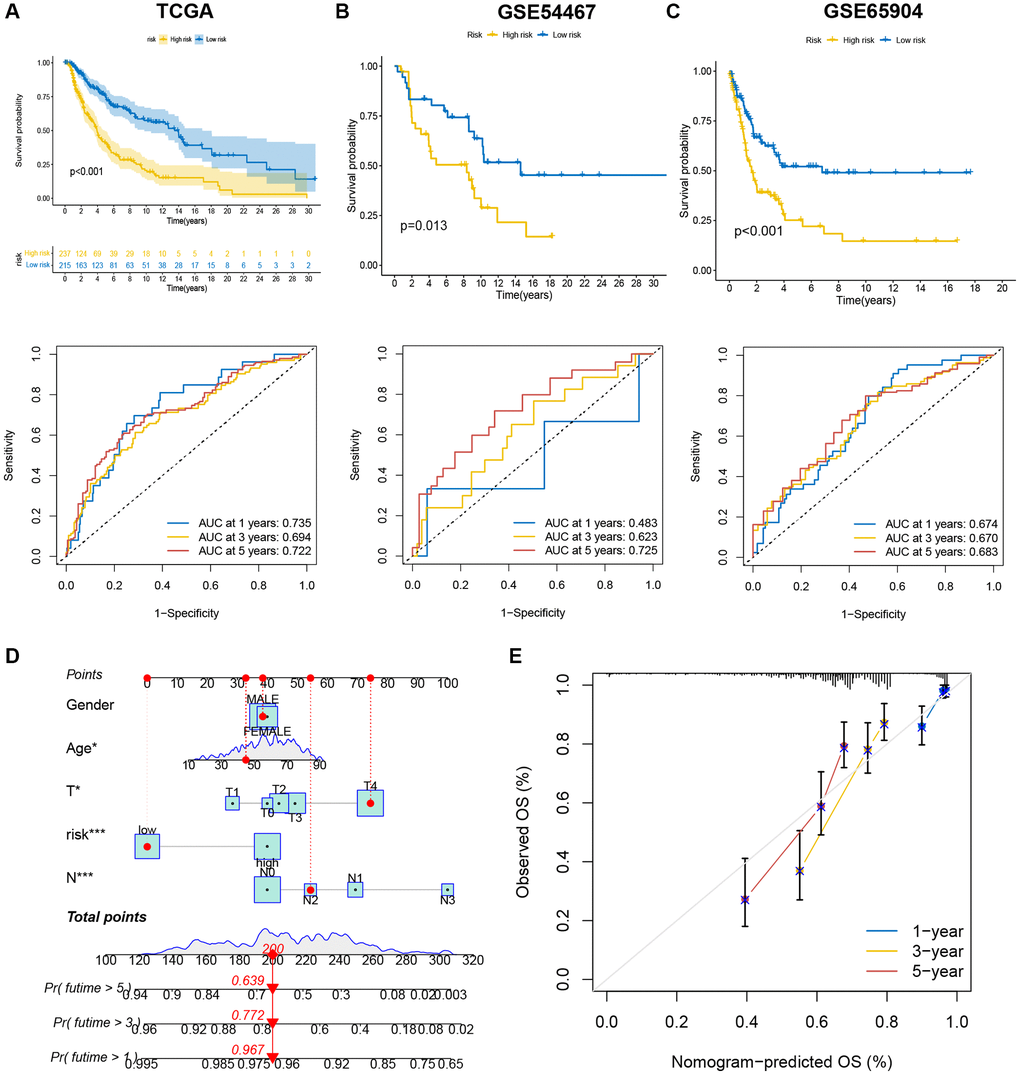
Figure 6.The efficiency of the risk score and comprehensive score in predicting patient survival. (A–C) K-M analysis and ROC curves showed the prognostic value in training and validation cohorts. (D) The nomogram showed the prognostic value of clinicopathological parameters and risk score. (E) The calibration plots indicate the accuracy and specificity of the nomogram.