Submit an Article
Navigate
Home
Editorial Board
Editorial Policies
Current Volume
Archive
Scientific Integrity
Publication Ethics Statements
Interviews with Outstanding Authors
Newsroom
Sponsored Conferences
Podcast
Contact
Special Collections
Submit an Article
Online ISSN: 1945-4589
Research Paper
|
Volume 15, Issue 11
|
pp. 4714–4733
KIF20A as a potential biomarker of renal and bladder cancers based on bioinformatics and experimental verification
Back to article
Figure 12
(12 of 13)
−
100%
+
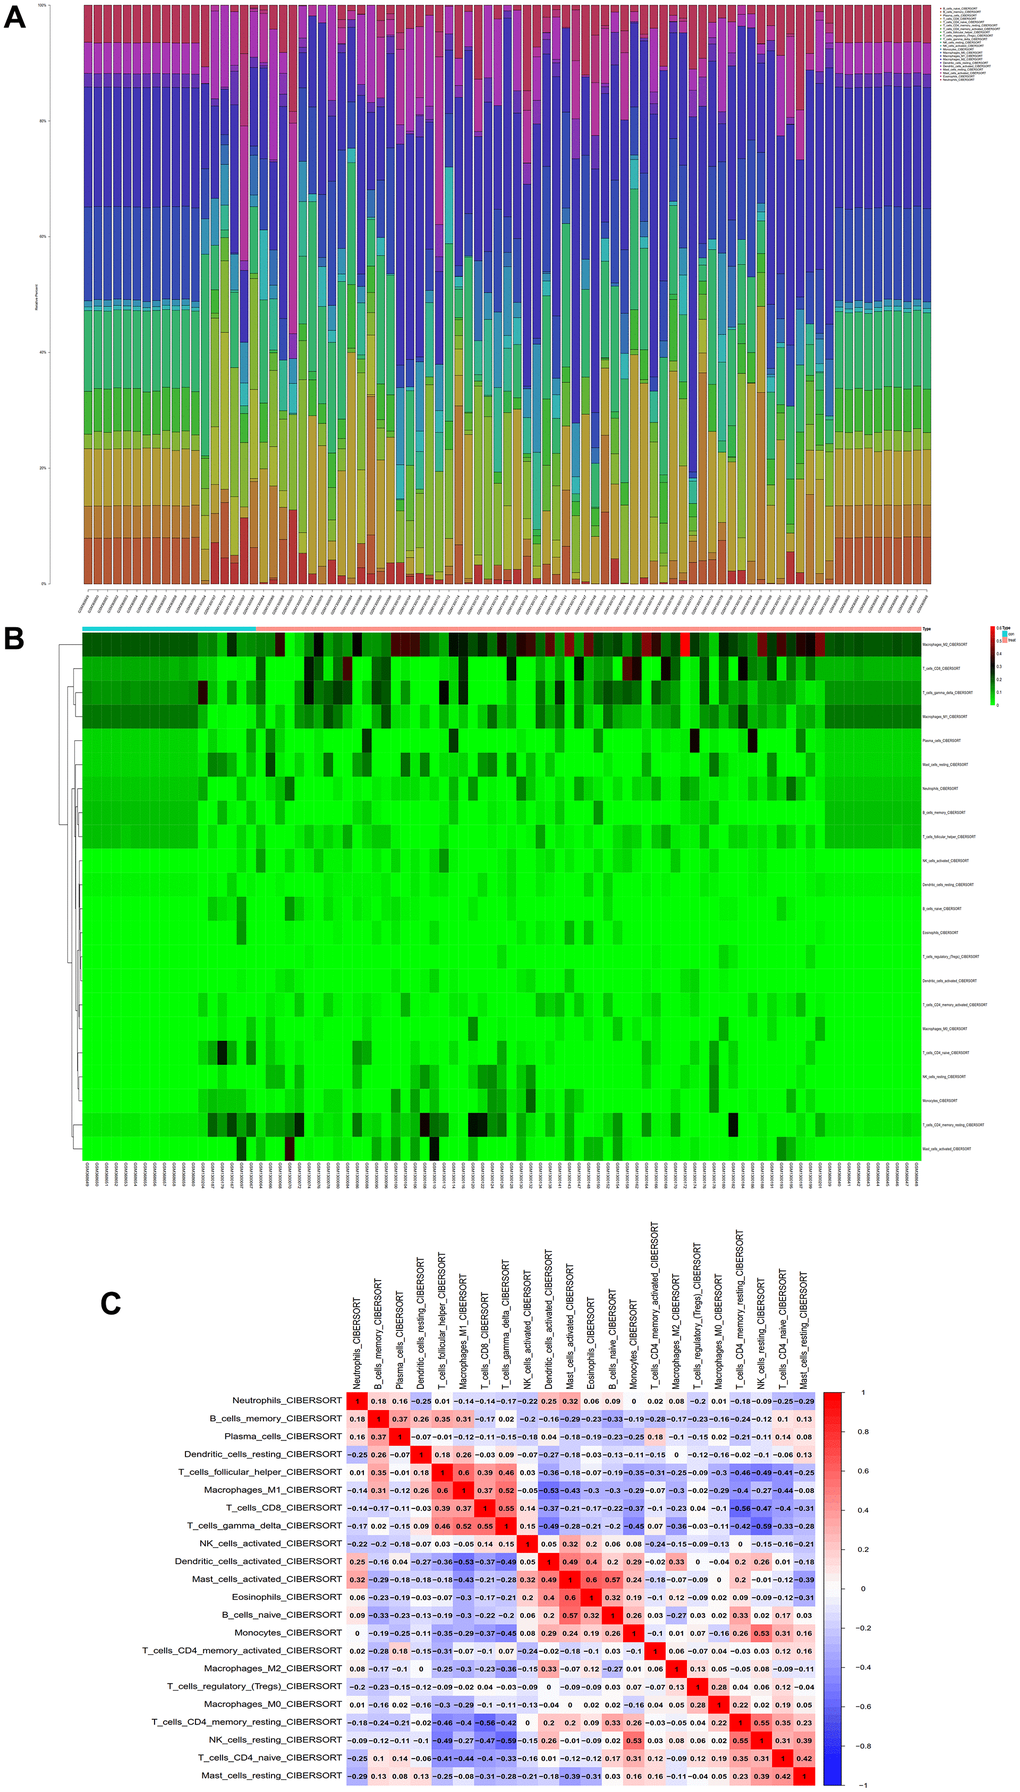
Figure 12.
Immunoinfiltration analysis.
(
A
) Whole-gene expression matrix results of proportions of immune cells. (
B
) Immune cell expression calorigram. (
C
) Plot of coexpression patterns between immune cell components.
Figure 12 — KIF20A as a potential biomarker of renal and bladder cancers based on bioinformatics and experimental verification | Aging