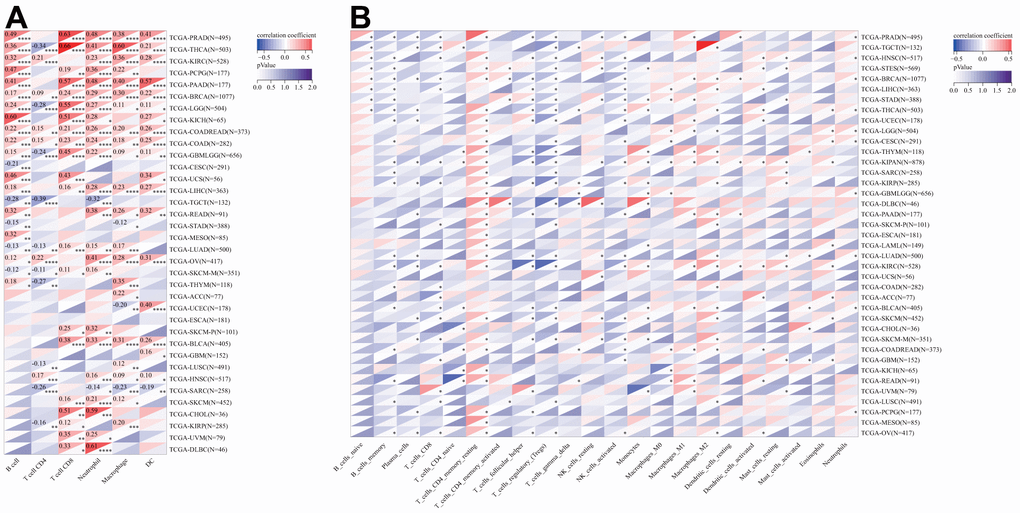
Figure 10.Relationship of DLAT expression with Immune cell infiltration analysis. (A) The relationship between DLAT expression levels and the levels of infiltration of 6 immune-related cells by using TIMER algorithm. (B) The relationship between DLAT expression levels and the levels of infiltration of 22 immune-related cells by using CIBERSOFT algorithm.