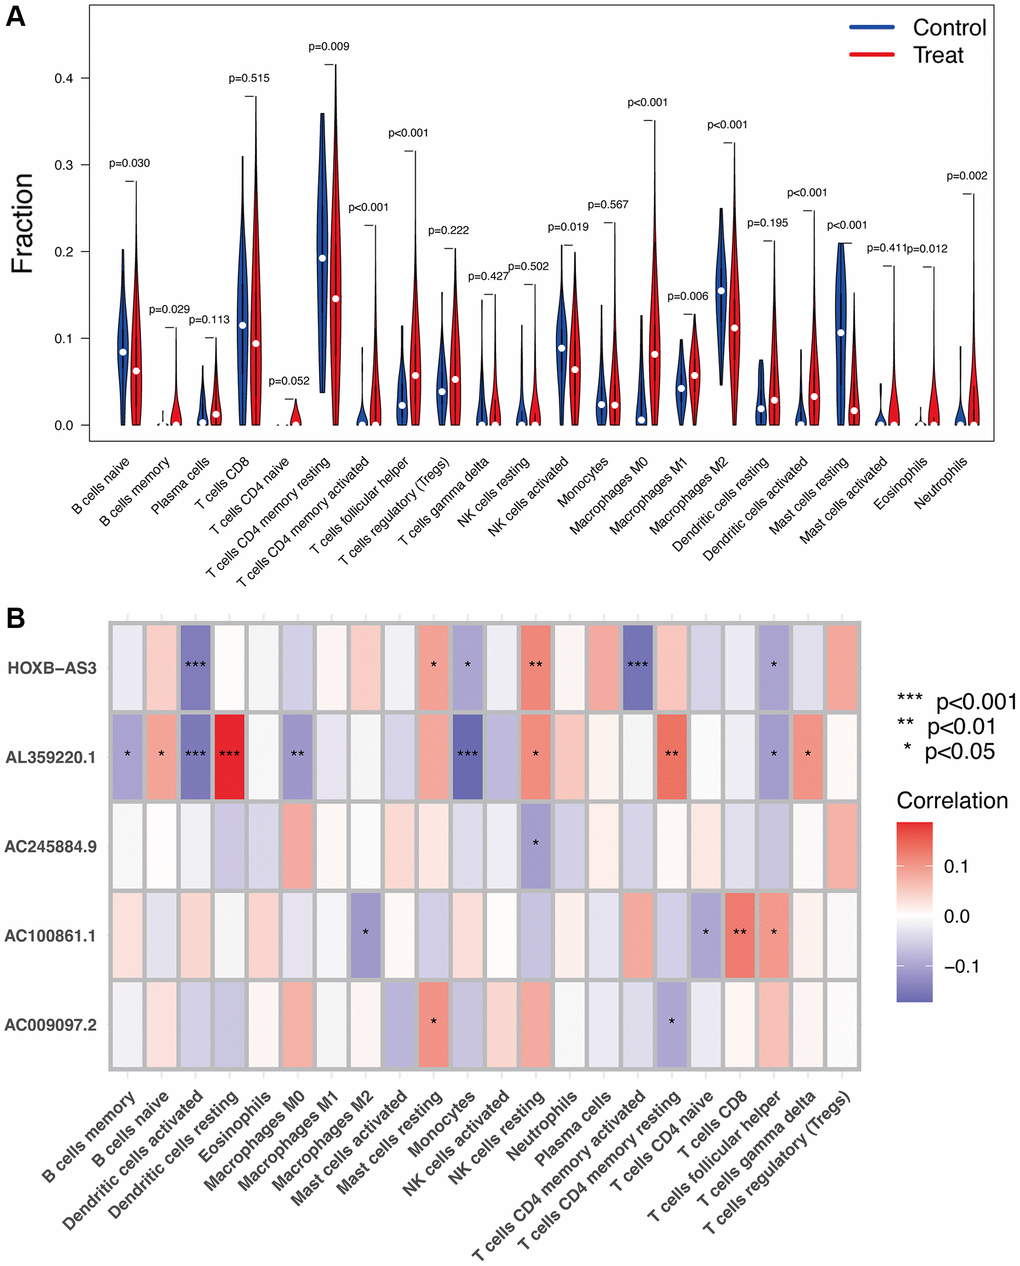
Figure 7.Immune infiltration analysis. (A) The proportion of 22 types of immune cells between normal control and UCEC samples. (B) Correlation heatmap depicting correlations between infiltrated immune cells and hub lncRNAs in UCEC.
Figure 7 — Identification and validation of oxeiptosis-associated lncRNAs and prognosis-related signature genes to predict the immune status in uterine corpus endometrial carcinoma | Aging