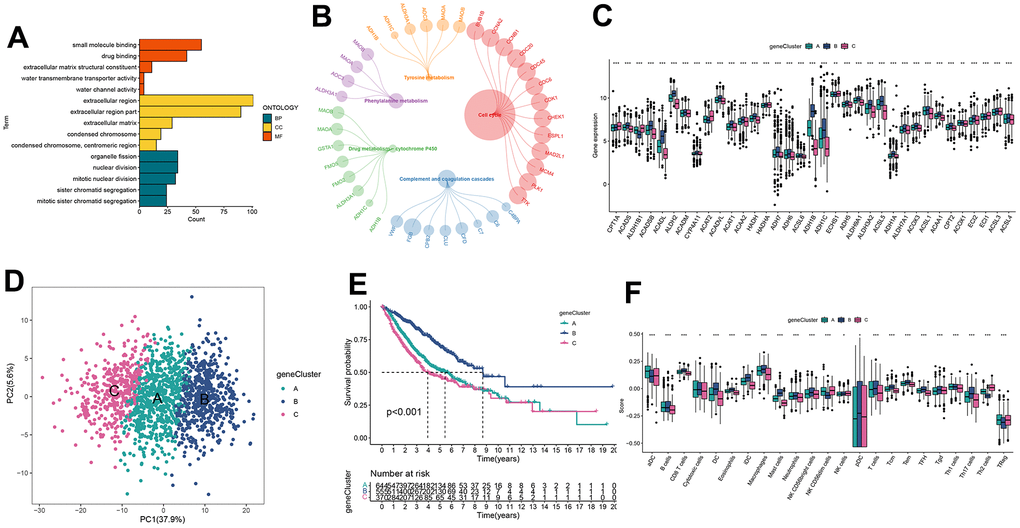
Figure 4.Identification of gene clusters based on DEGs. (A, B) GO and KEGG enrichment analyses of DEGs among two FARGs clusters. (C) Expression of FARGs between gene clusters A, B and C. (D) PCA plot based on the DEGs. (E) Kaplan–Meier curves for the different gene clusters. (F) Different expressions of immune infiltration cells in each gene cluster. ns, not significant, *P < 0.05, **P < 0.01, ***P < 0.001, ****P < 0.0001.