Submit an Article
Navigate
Home
Editorial Board
Editorial Policies
Current Volume
Archive
Scientific Integrity
Publication Ethics Statements
Interviews with Outstanding Authors
Newsroom
Sponsored Conferences
Podcast
Contact
Special Collections
Submit an Article
Online ISSN: 1945-4589
Research Paper
|
Volume 15, Issue 9
|
pp. 3807–3825
Identification and validation of metabolism-related genes signature and immune infiltration landscape of rheumatoid arthritis based on machine learning
Back to article
Figure 6
(6 of 12)
−
100%
+
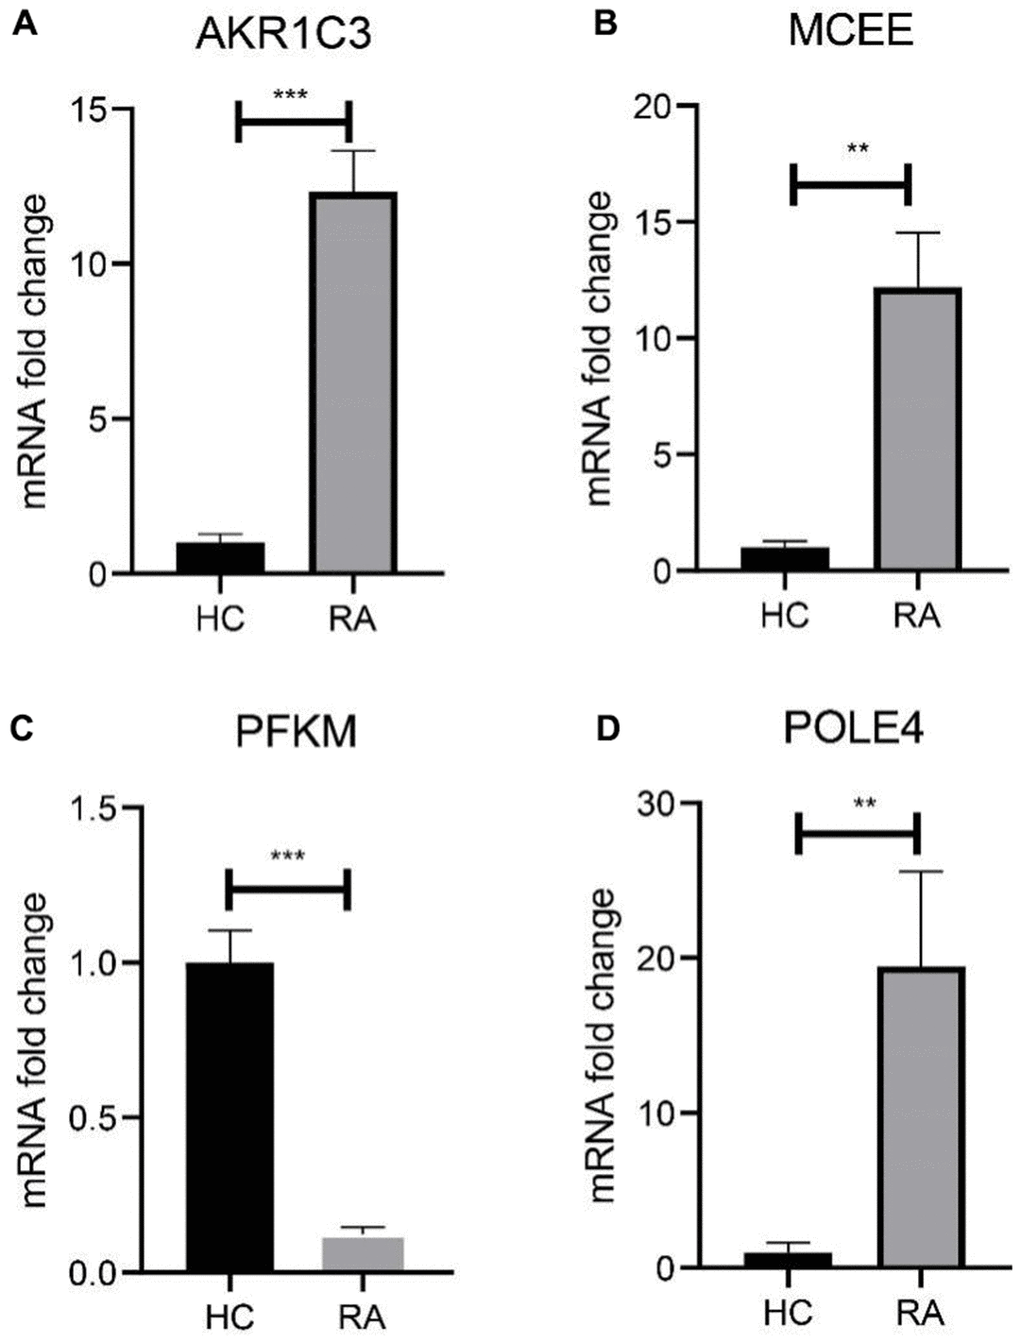
Figure 6.
Validation of 4 diagnostic feature biomarkers in clinical tissues via qRT-PCR.
The expression of (
A
) AKR1C3, (
B
) MCEE, (
C
) PFKM and (
D
) POLE4. Statistical significance: *P < 0.05; **P < 0.01; ***P < 0.001. ns: no significance.