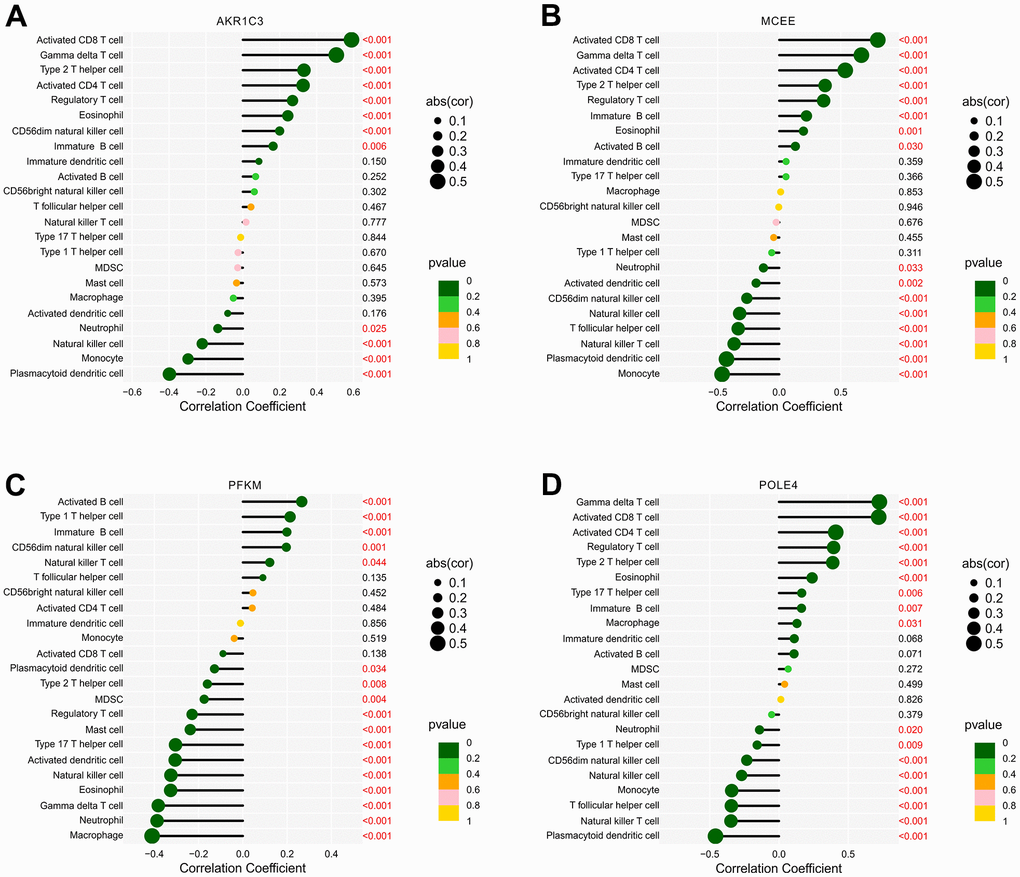
Figure 12.Correlation analysis of diagnostic feature biomarkers and immune infiltration cells. The lollipop diagram illustrates the correlation of 23 immune cells and (A) AKR1C3, (B) MCEE, (C) PFKM, and (D) POLE4. The dot represents the absolute value of the correlation coefficient, and the p -values are annotated with different colors. p < 0.05 is considered statistically significant.