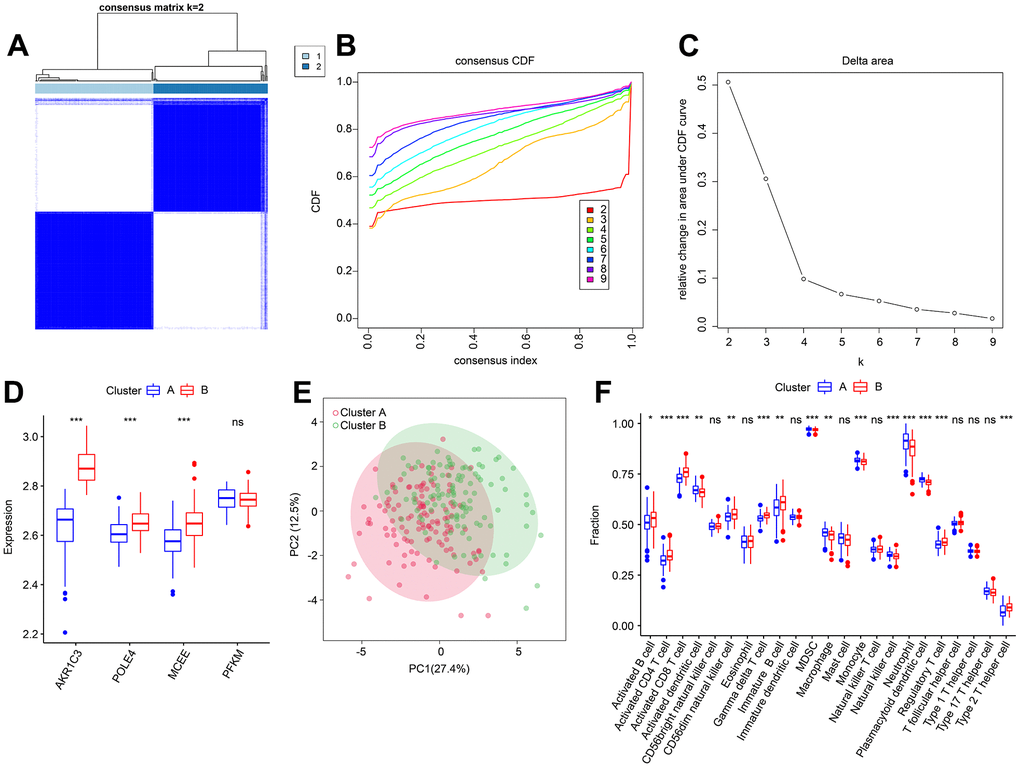
Figure 11.Consensus clustering analysis of RA samples based on 4 diagnostic feature biomarkers. (A) The consensus clustering heatmap shows the optimal K classification = 2-9. (B) Consensus CDF. (C) Delta area. (D) Expression of 4 diagnostic feature biomarkers in Cluster A and Cluster B. (E) PCA score plot. (F) The proportion of 23-types immune cells of patients with RA in Cluster A and B.