Submit an Article
Navigate
Home
Editorial Board
Editorial Policies
Current Volume
Archive
Scientific Integrity
Publication Ethics Statements
Interviews with Outstanding Authors
Newsroom
Sponsored Conferences
Podcast
Contact
Special Collections
Submit an Article
Online ISSN: 1945-4589
Research Paper
|
Volume 15, Issue 9
|
pp. 3771–3790
The prognostic significance and immune correlation of SLC10A3 in low-grade gliomas revealed by bioinformatic analysis and multiple immunohistochemistry
Back to article
Figure 2
(2 of 7)
−
100%
+
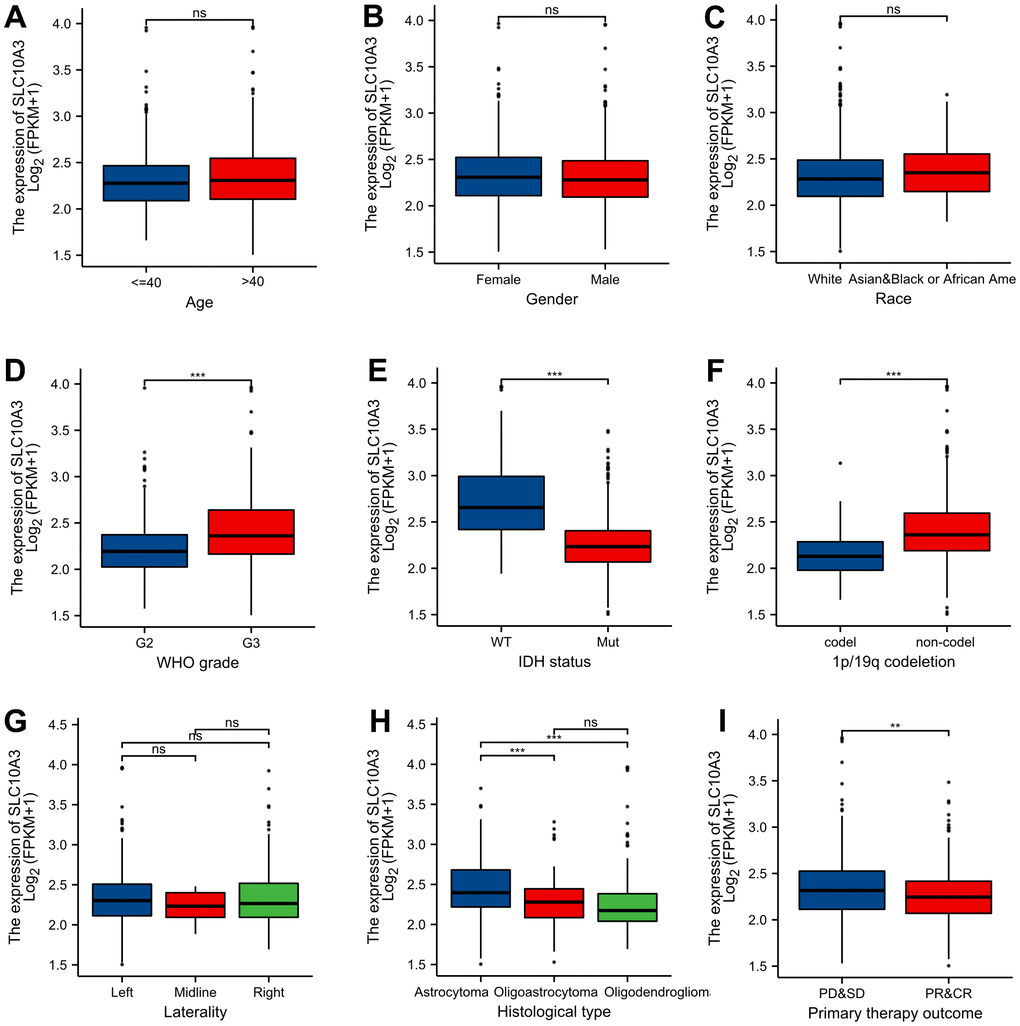
Figure 2.
Distribution of
SLC10A3
transcription among different clinical groups.
(
A
) age. (
B
) gender. (
C
) race. (
D
) WHO grade. (
E
) IDH mutation status. (
F
) 1p19q co-deletion. (
G
) laterality. (
H
) histological type. (
I
) primary therapy outcome.