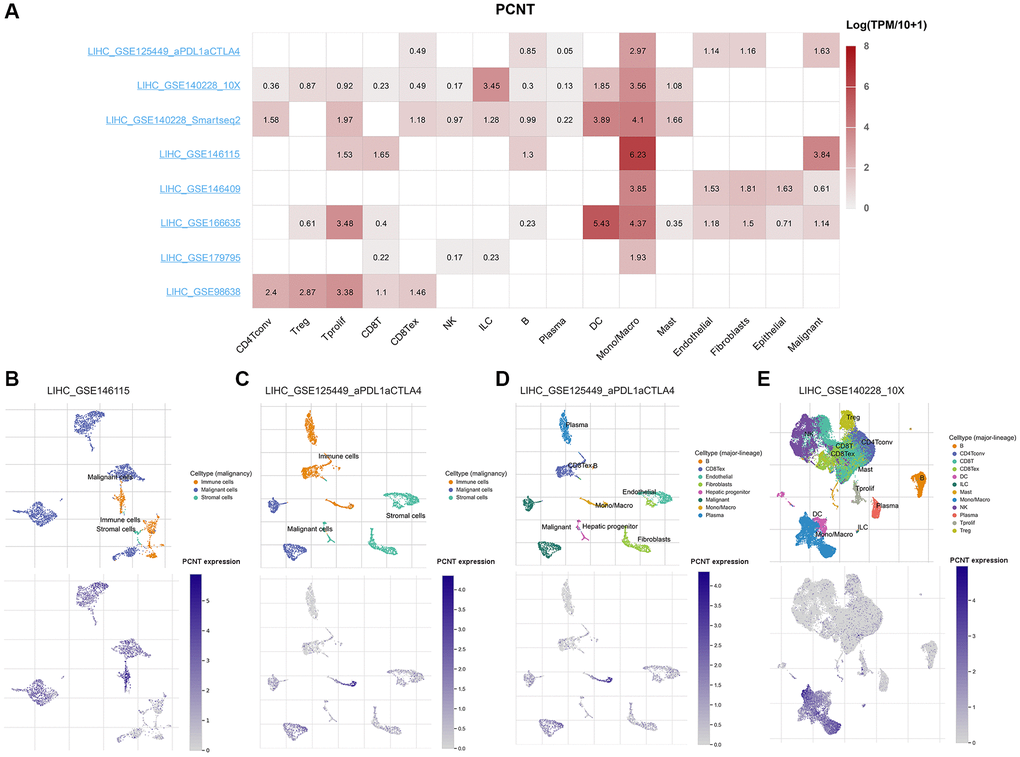
Figure 8.PCNT expression at the single-cell level. (A) The matrix heat map presented the PCNT mRNA levels in malignant, stromal, and different types of cells. (B) The PCNT mRNA levels and cell distributions in LIHC_GSE146115 (B) and LIHC_GSE125449a_PDL1aCTLA4 (C) datasets. (D) Normal hepatic progenitors detected low PCNT mRNA levels in LIHC_GSE125449a_PDL1aCTLA4 dataset. (E) The distributions and PCNT mRNA levels in different types of immune cells in LIHC_GSE140228_10X dataset.