Submit an Article
Navigate
Home
Editorial Board
Editorial Policies
Current Volume
Archive
Scientific Integrity
Publication Ethics Statements
Interviews with Outstanding Authors
Newsroom
Sponsored Conferences
Podcast
Contact
Special Collections
Submit an Article
Online ISSN: 1945-4589
Research Paper
|
Volume 15, Issue 9
|
pp. 3738–3758
Comprehensive analysis of the oncogenic and immunological role of FAP and identification of the ceRNA network in human cancers
Back to article
Figure 7
(7 of 11)
−
100%
+
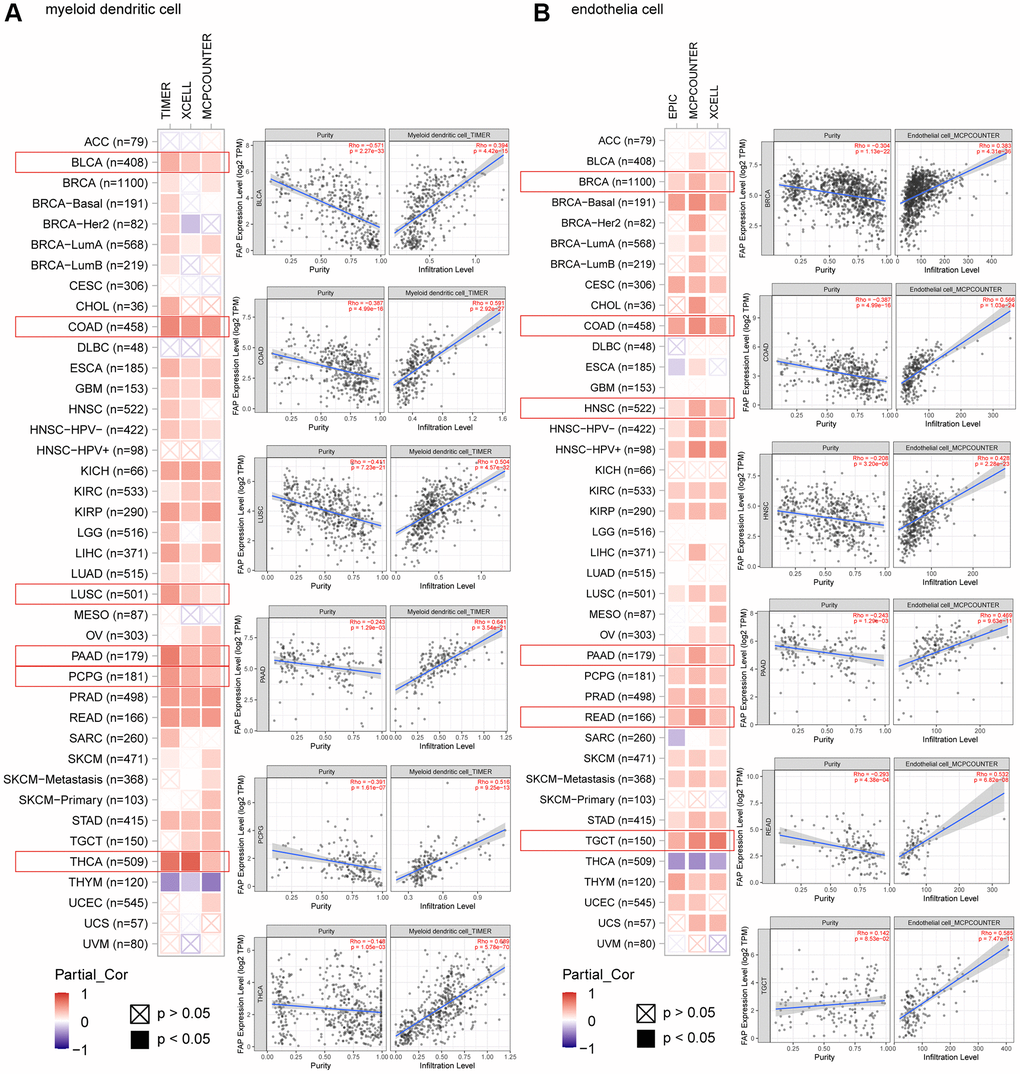
Figure 7.
Correlation analysis between
FAP
expression and infiltration of (
A
) myeloid dendritic cells and (
B
) endothelia cells by different algorithms. Classic scatter plotters were presented.