Submit an Article
Navigate
Home
Editorial Board
Editorial Policies
Current Volume
Archive
Scientific Integrity
Publication Ethics Statements
Interviews with Outstanding Authors
Newsroom
Sponsored Conferences
Podcast
Contact
Special Collections
Submit an Article
Online ISSN: 1945-4589
Research Paper
|
Volume 15, Issue 9
|
pp. 3690–3714
MGME1 associates with poor prognosis and is vital for cell proliferation in lower-grade glioma
Back to article
Figure 4
(4 of 9)
−
100%
+
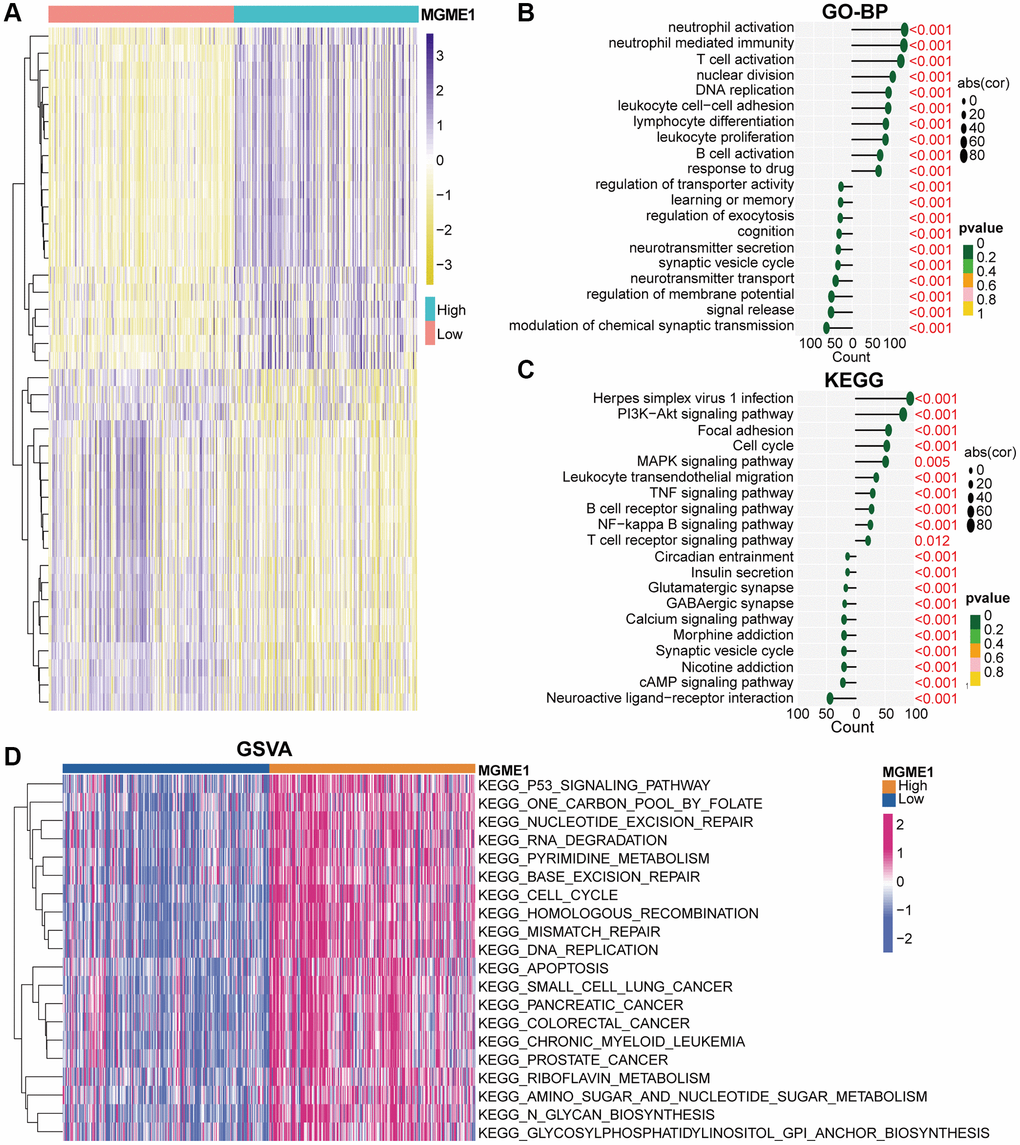
Figure 4.
Biological functions of MGME1 in LGG in TCGA.
(
A
) DEGs in the low-MGME1 and high-MGME1 expression subgroups. (
B
,
C
) The GO-BP (
B
) and KEGG (
C
) analyses for MGME1 in patients with LGG in the TCGA dataset. (
D
) GSVA in the TCGA dataset.