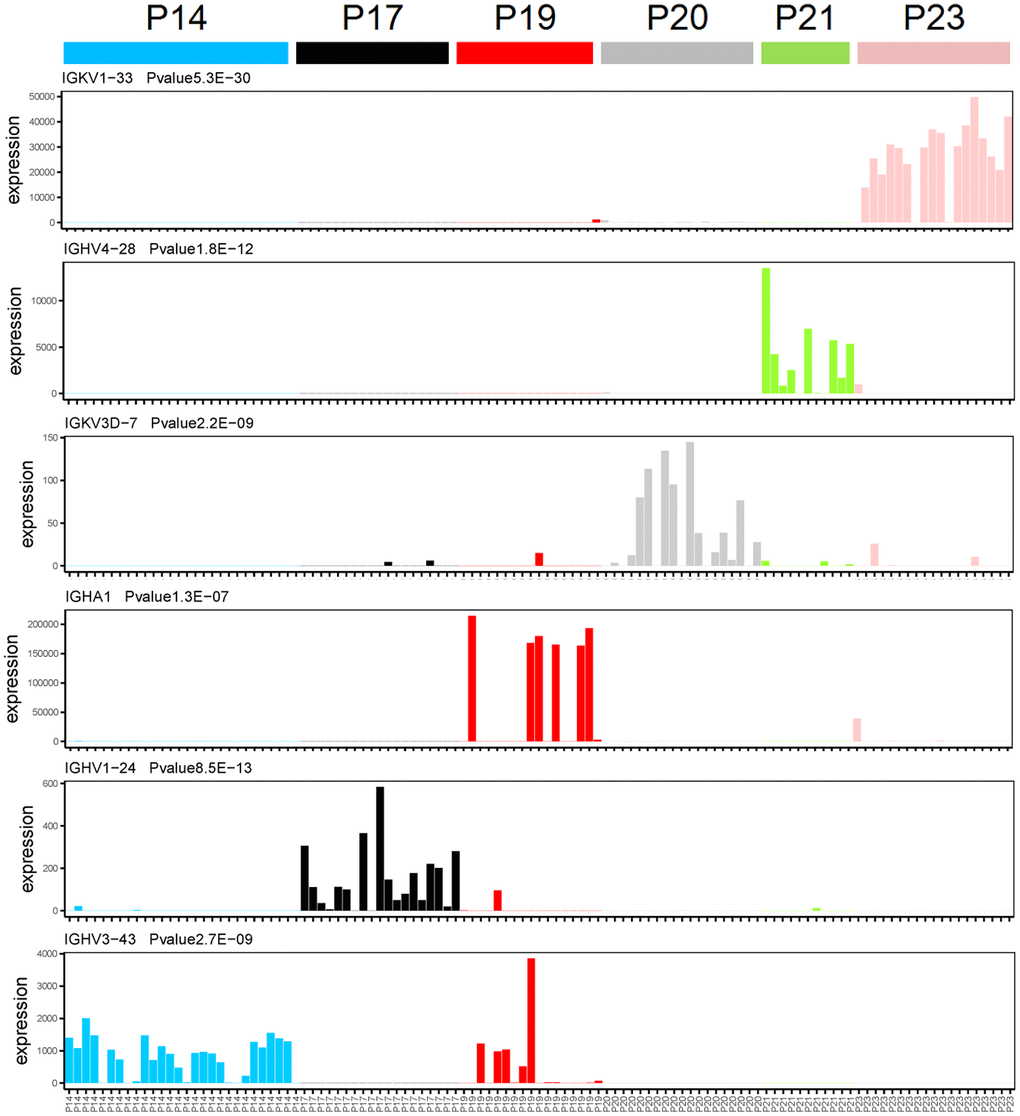
Figure 1.Immunoglobulin genes specifically expressed in each patient at the single cell transcriptome level. The X-axis and Y-axis represent the single cell and expression level (FPKM), respectively. One-way analysis of variance, the gene name and P-value were showed in top left corner of each figure.