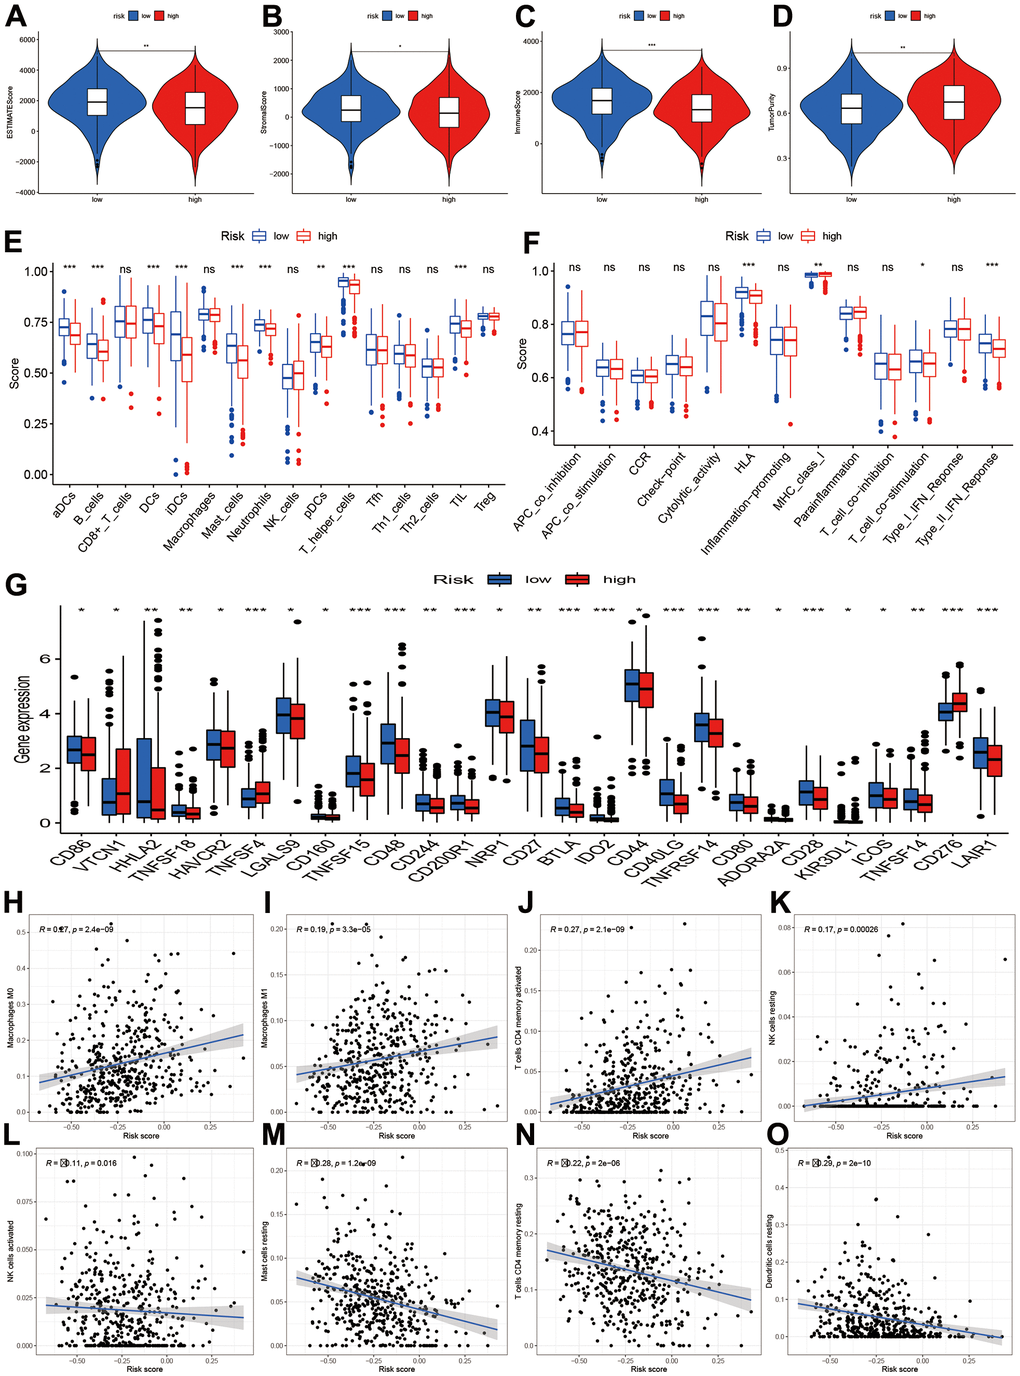
Figure 7.Tumor microenvironment and immune infiltration level. (A–D) Comparisons of ESTIMATE, stromal, immune and tumor purity between high- and low-risk groups; (E, F) Immune cell infiltration and function score between high- and low-risk group. (G) Comparisons of immune-related genes expression levels between two risk groups. (H–O) Scatter plot for the correlations of risk score with some immune infiltration cells, including macrophages M0, M1, T cells CD4 memory, NK cells, Mast cells, Dendritic cells.