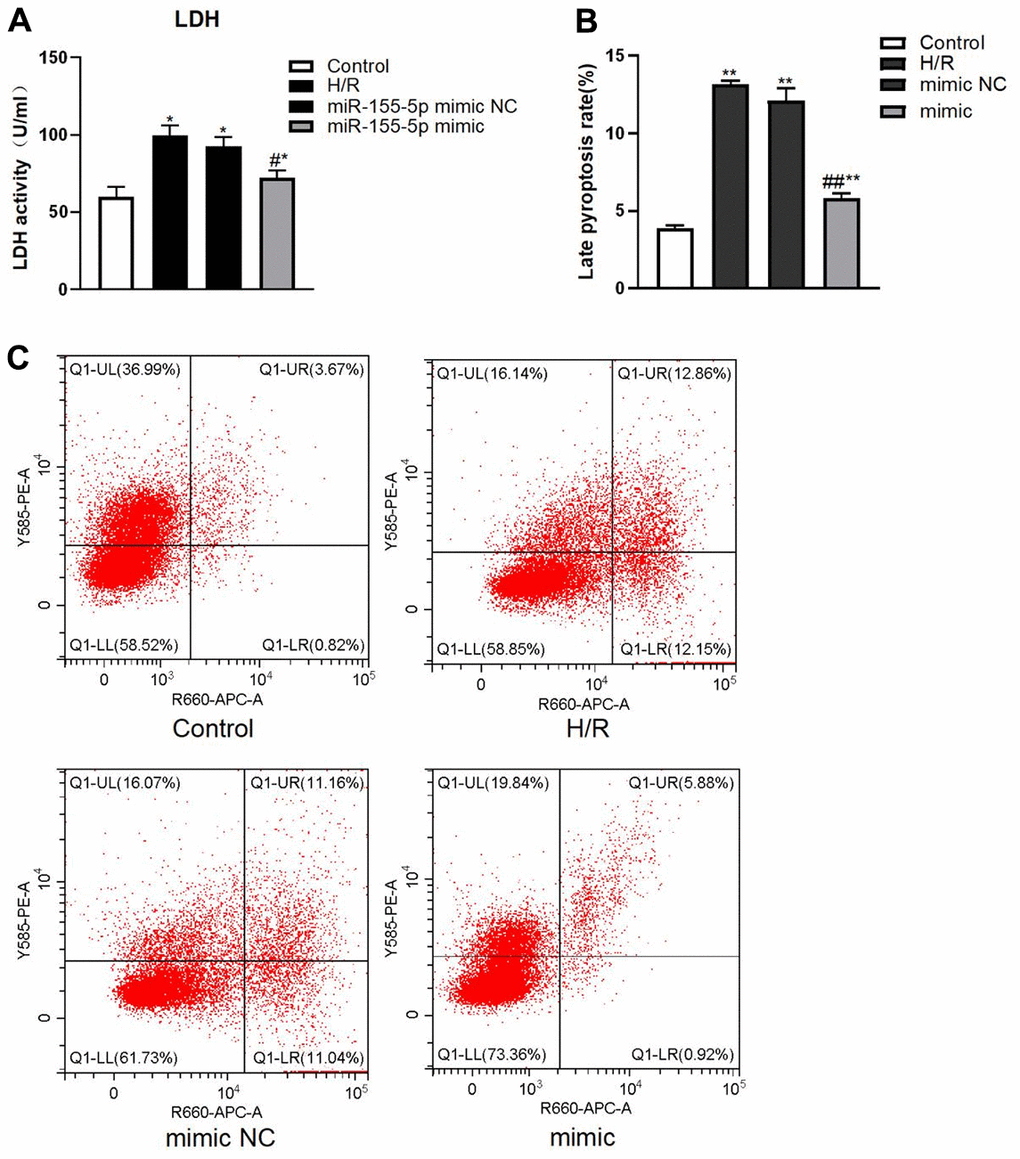
Figure 5.Changes of LDH and pyroptosis rate in all HK2 groups. (A) Expression of LDH activity. (B) Late pyroptosis rate of HK2 cell, (C) Flow cytometric graphs showing cell pyroptosis. The red dots in higher right quadrant of each flow cytometry diagram indicate pyroptosis cells. (*p<0.05, **p<0.01, compared with the blank group, #p<0.05, ##p<0.05, compared with the H/R group and the miR-155-5p mimic NC group).