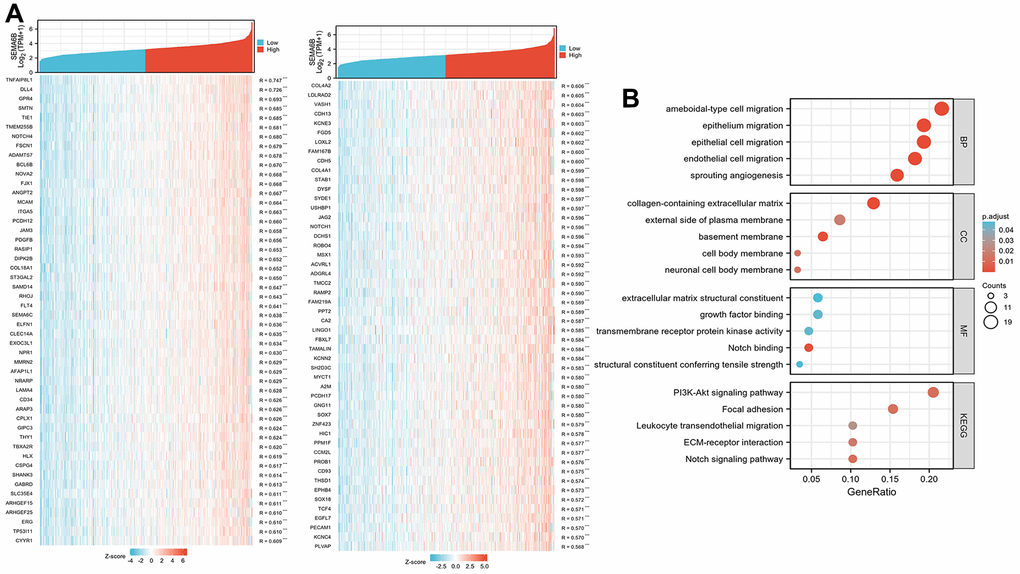
Figure 7.Differentially expressed gene profiling between group SEMA6B-high expression and group SEMA6B-low expression. Differentially expressed genes were ranked by correlation factor R (A), and the gene list was further clustered via GO/KEGG analysis (B).