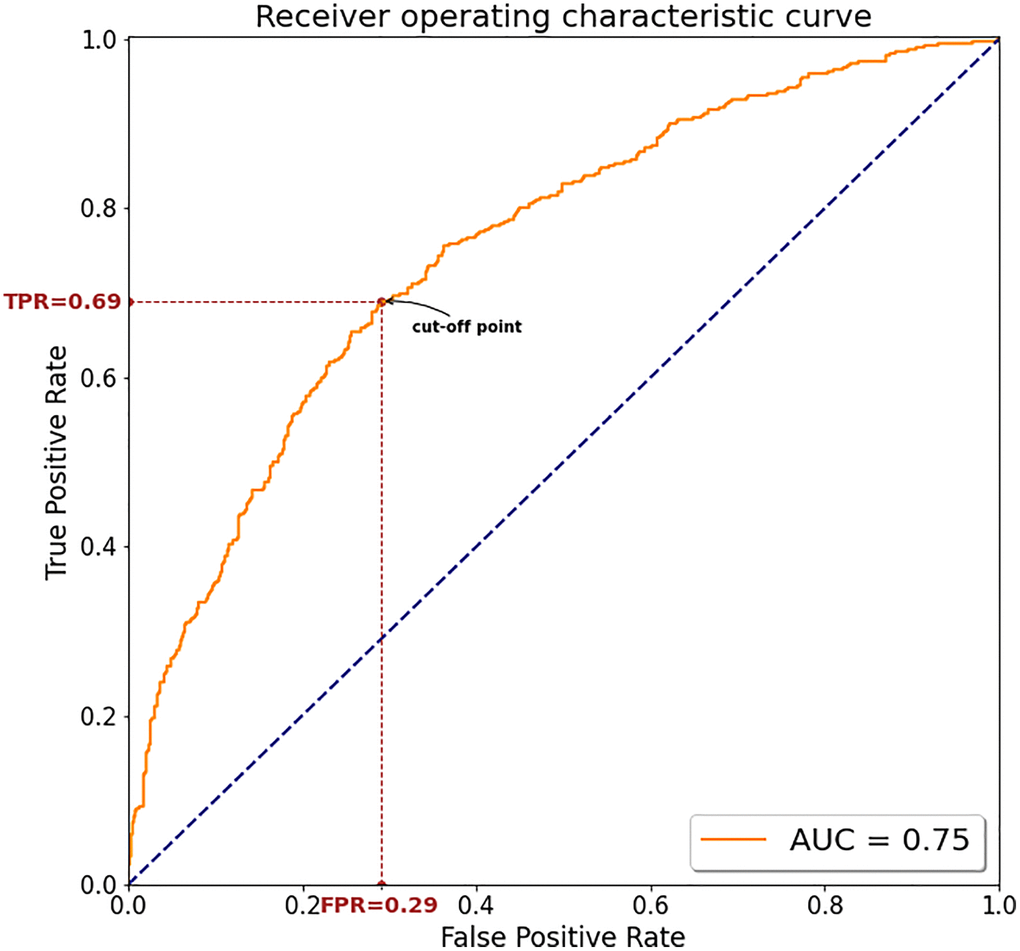
Figure 2.The ROC curve for the model's screening performance on the test dataset using 8 leads. The minimum distance between the ROC curve and the upper left corner was used to determine the optimal cutoff for best discrimination between CAD and non-CAD. Abbreviations: AUC: area under the curve; TPR: true positive rate; FPR: False Positive Rate.