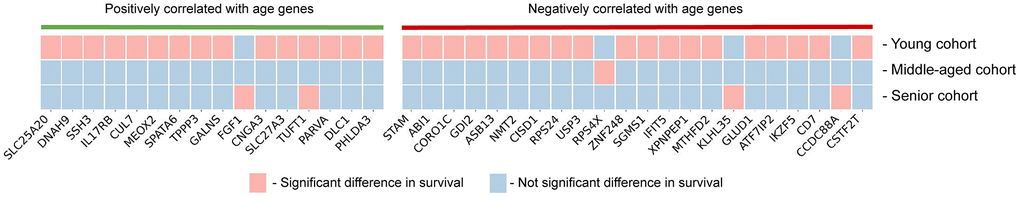
Figure 3.Survival analysis results. Each of the genes that is significantly correlated with age (n = 38) was tested for significant or not significant difference in survival rates with respect to the high and low expression levels in young, middle-aged and senior patient cohorts from TCGA-GBM dataset.