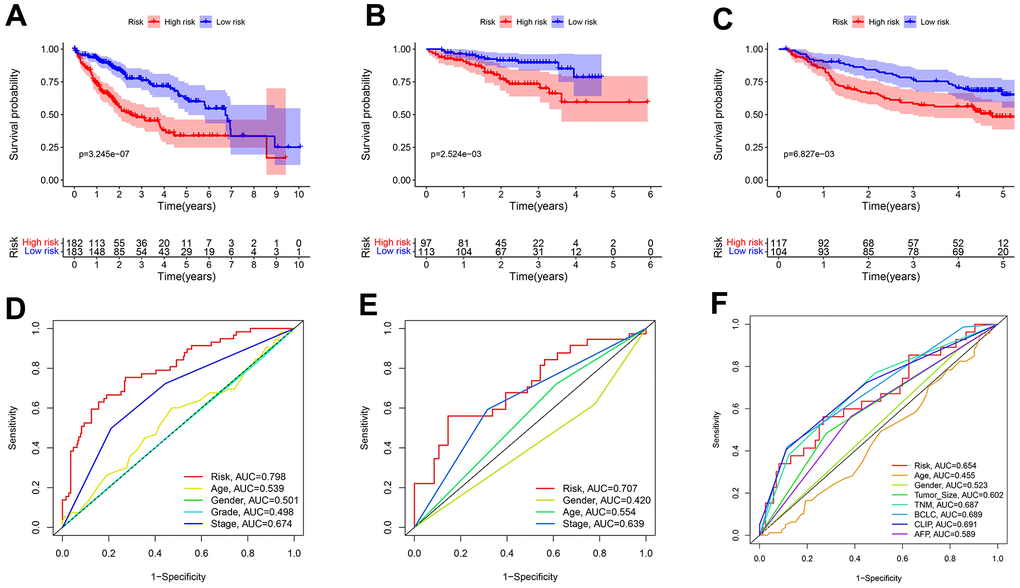
Figure 5.Predicting patient survival for the transcriptional addiction gene signature. (A) Survival analysis of different risk groups based on 365 patients from TCGA-LIHC set. (B) Survival analysis of risk groups based on 210 patients from ICGC-JP set. (C) Survival analysis of different risk groups based on 221 patients from GEO-GSE14520 set. (D) The time-dependent ROC curve of the risk score and clinicopathological characteristics in TCGA-LIHC set. (E) The time-dependent ROC curve of the risk score and clinicopathological characteristics in ICGC-JP set. (F) The time-dependent ROC curve of the risk score and clinicopathological characteristics in GEO-GSE14520 set.