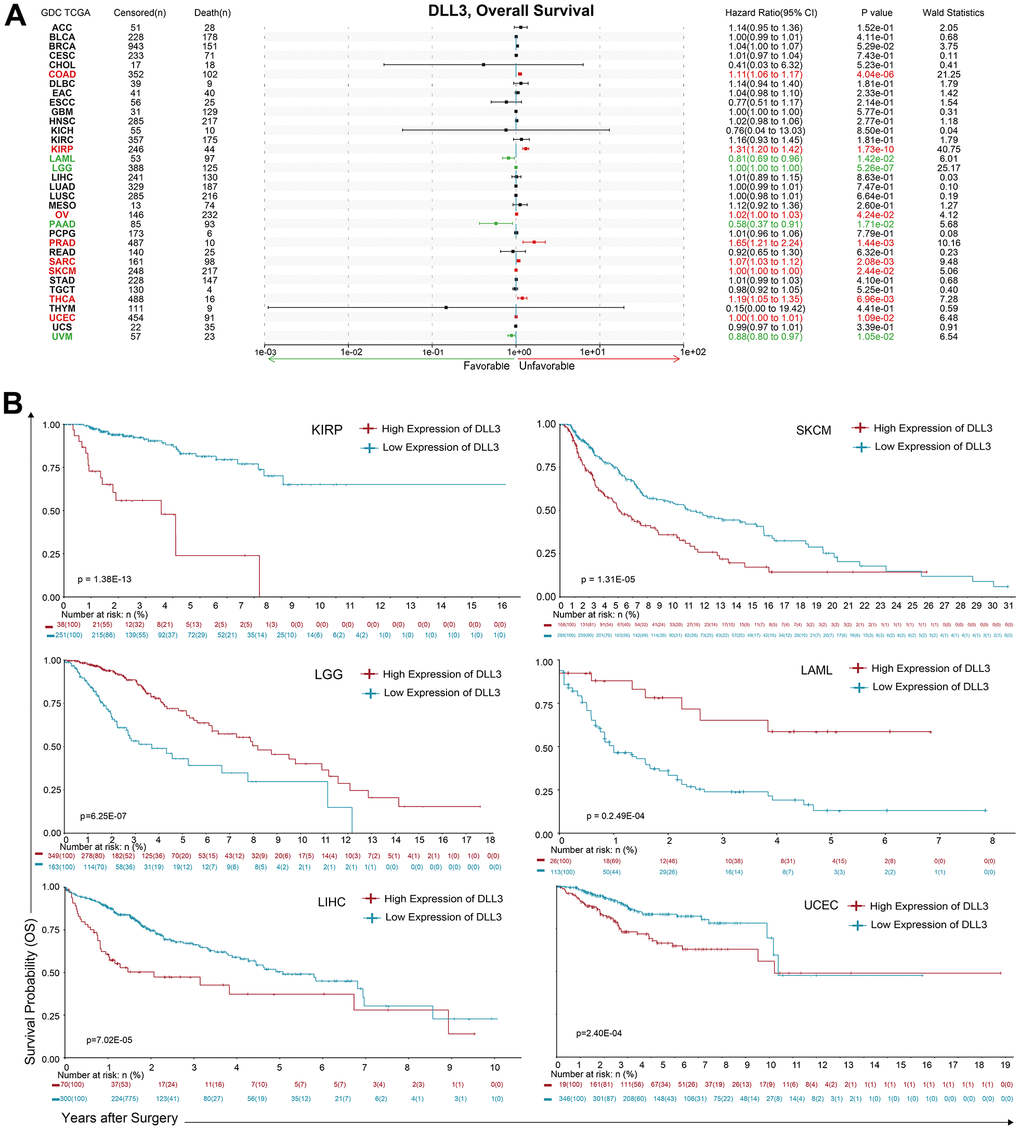
Figure 2.Association between DLL3 expression and overall survival time in days (OS). (A) Forest plot of OS associations in 34 types of tumor. (B) Kaplan-Meier analysis of the association between DLL3 expression and OS.
Figure 2 — Biological and immunological significance of DLL3 expression in different tumor tissues: a pan-cancer analysis | Aging