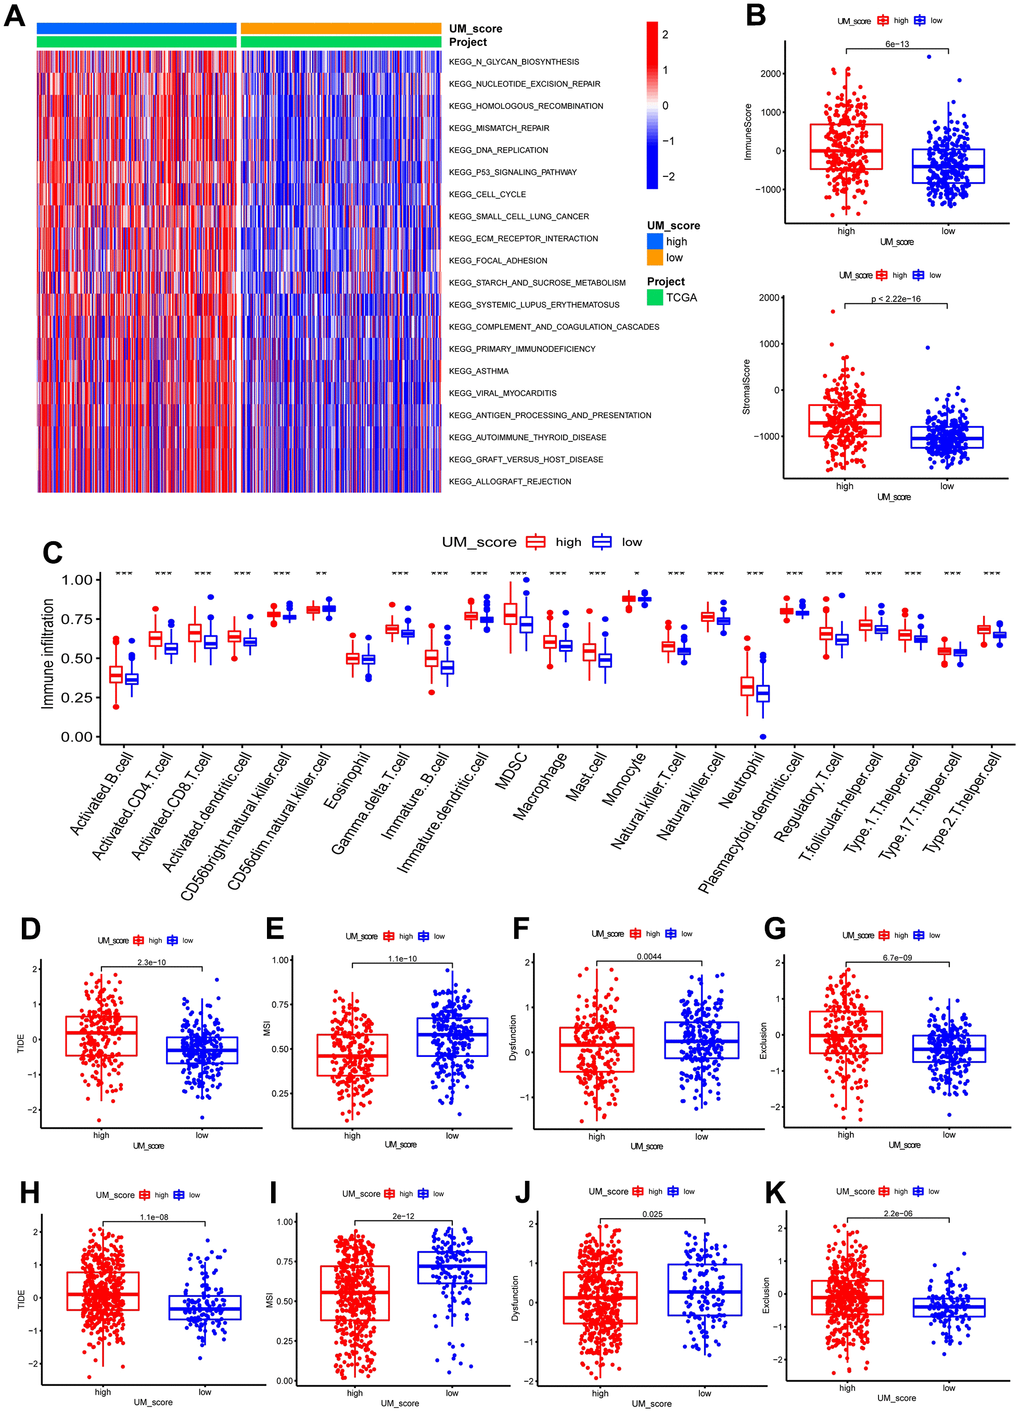
Figure 6.UM-score in the role of immunotherapy. (A) GSVA enrichment analysis in the UM-score subgroups. (B) Distinction in the immune scores and stromal scores between the UM-score subgroups in TCGA-LGG cohorts. (C) Abundance of immune cell in the UM-score subgroups. (D) Distinction in the TIDE score between the UM-score subgroups in TCGA-LGG cohorts. (E) Distinction in the MSI score between the UM-score subgroups in TCGA-LGG cohorts. (F) Distinction in the T-cell dysfunction score between the UM-score subgroups in TCGA-LGG cohorts. (G) Distinction in the T-cell exclusion score between the UM-score subgroups in TCGA-LGG cohorts. (H) Distinction in the TIDE score between the UM-score subgroups in CGGA-LGG cohorts. (I) Distinction in the MSI score between the UM-score subgroups in CGGA-LGG cohorts. (J) Distinction in the T-cell dysfunction score between the UM-score subgroups in CGGA-LGG cohorts. (K) Distinction in the T-cell exclusion score between the UM-score subgroups in CGGA-LGG cohorts.