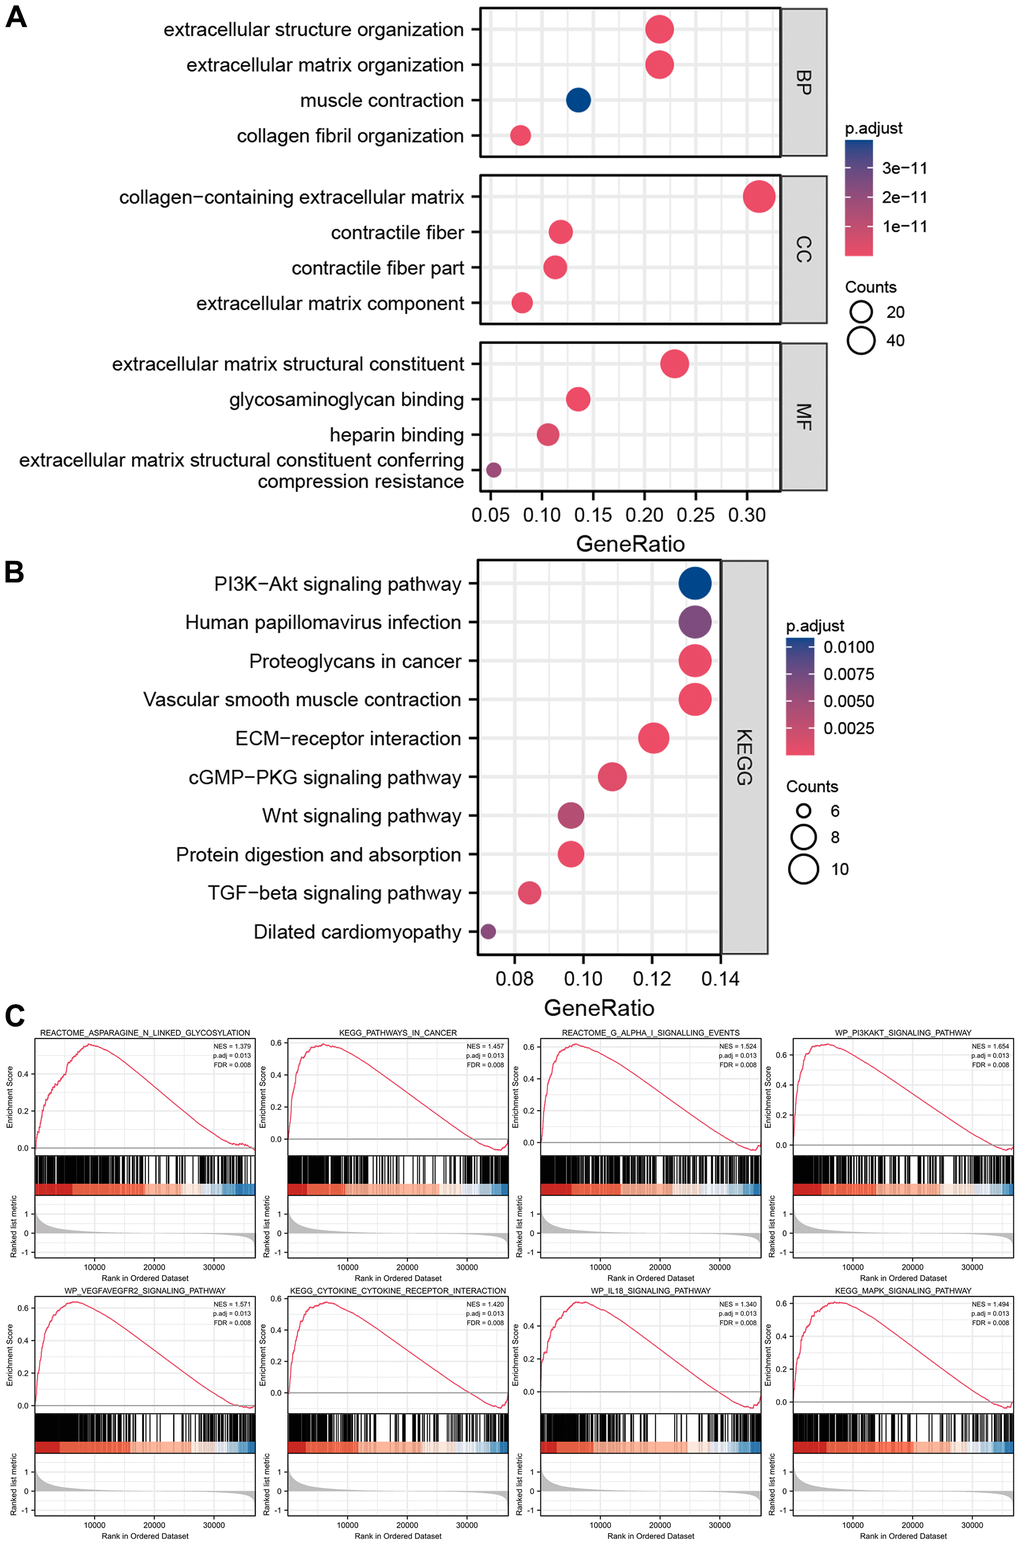
Figure 8.Enrichment analyses and GSEA analysis of differentially expressed genes between high-risk groups and low-risk groups. (A) The results of GO analysis. (B) The results of KEGG analysis. (C) The results of GSEA analysis between high-risk groups and low-risk groups.