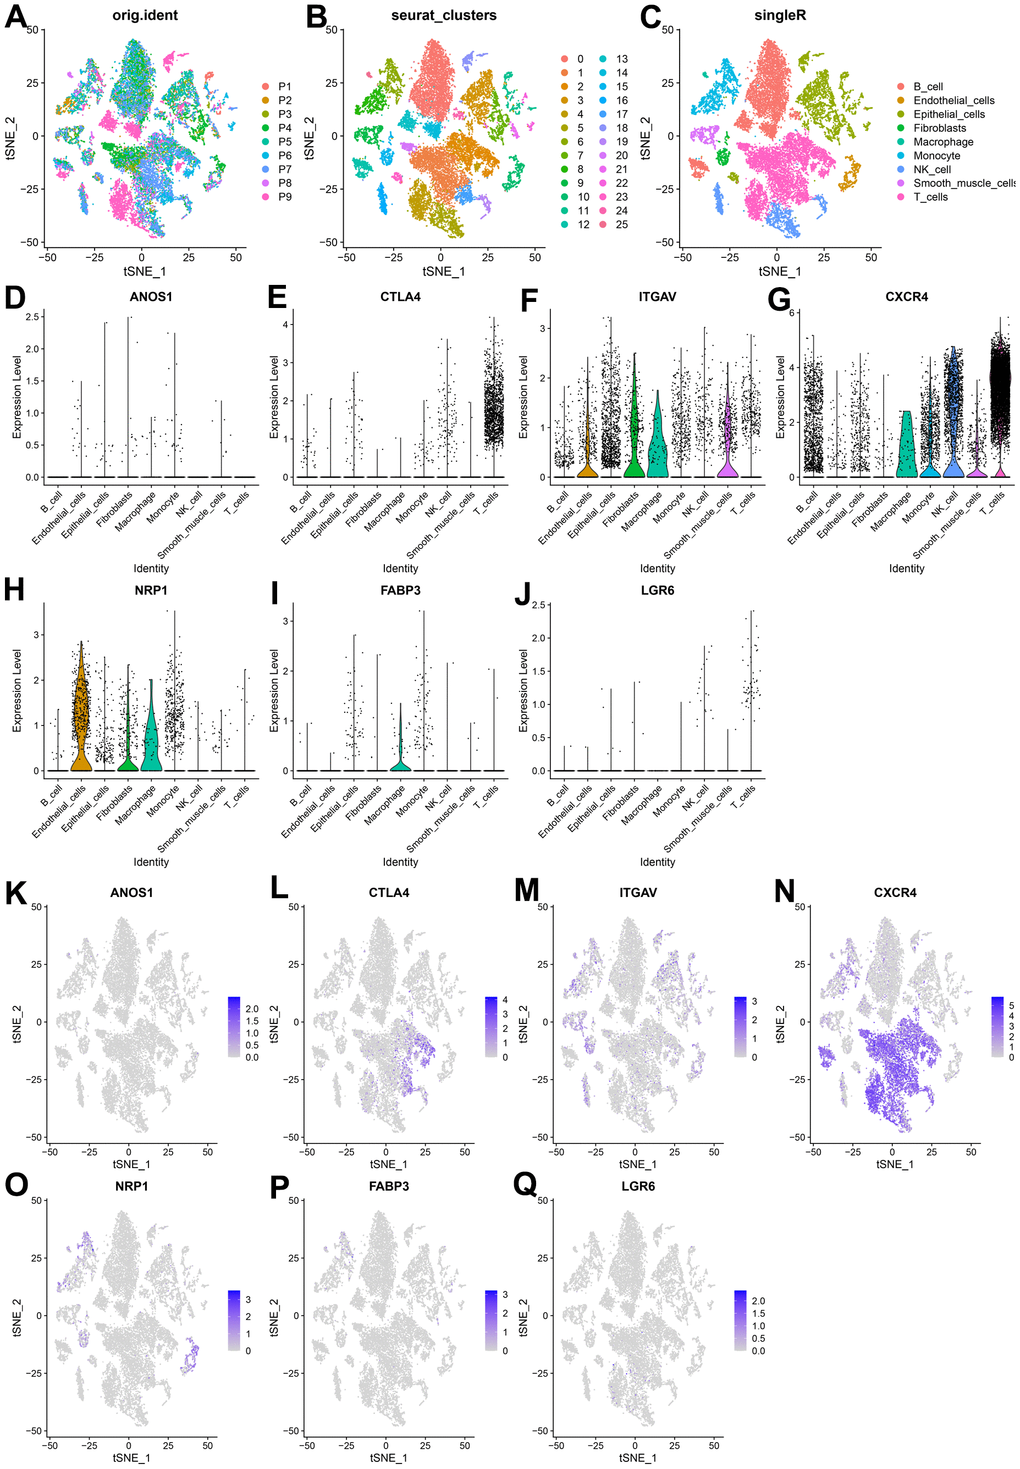
Figure 11.Expression of CRIGs ANOS1, CTLA4, ITGAV, CXCR4, NRP1, FABP3 and LGR6 in GC single cells. (A) Cell t-SNE distribution among different samples. (B) T-SNE distribution of 25 independent cell clusters. (C) T-SNE distribution of cell types after SingleR annotation. (D–J) Violin plots of ANOS1, CTLA4, ITGAV, CXCR4, NRP1, FABP3 and LGR6 abundance in GC at Single Cell Level. (K–Q) The t-SNE distribution of ANOS1, CTLA4, ITGAV, CXCR4, NRP1, FABP3 and LGR6 abundance in GC at Single Cell Level.