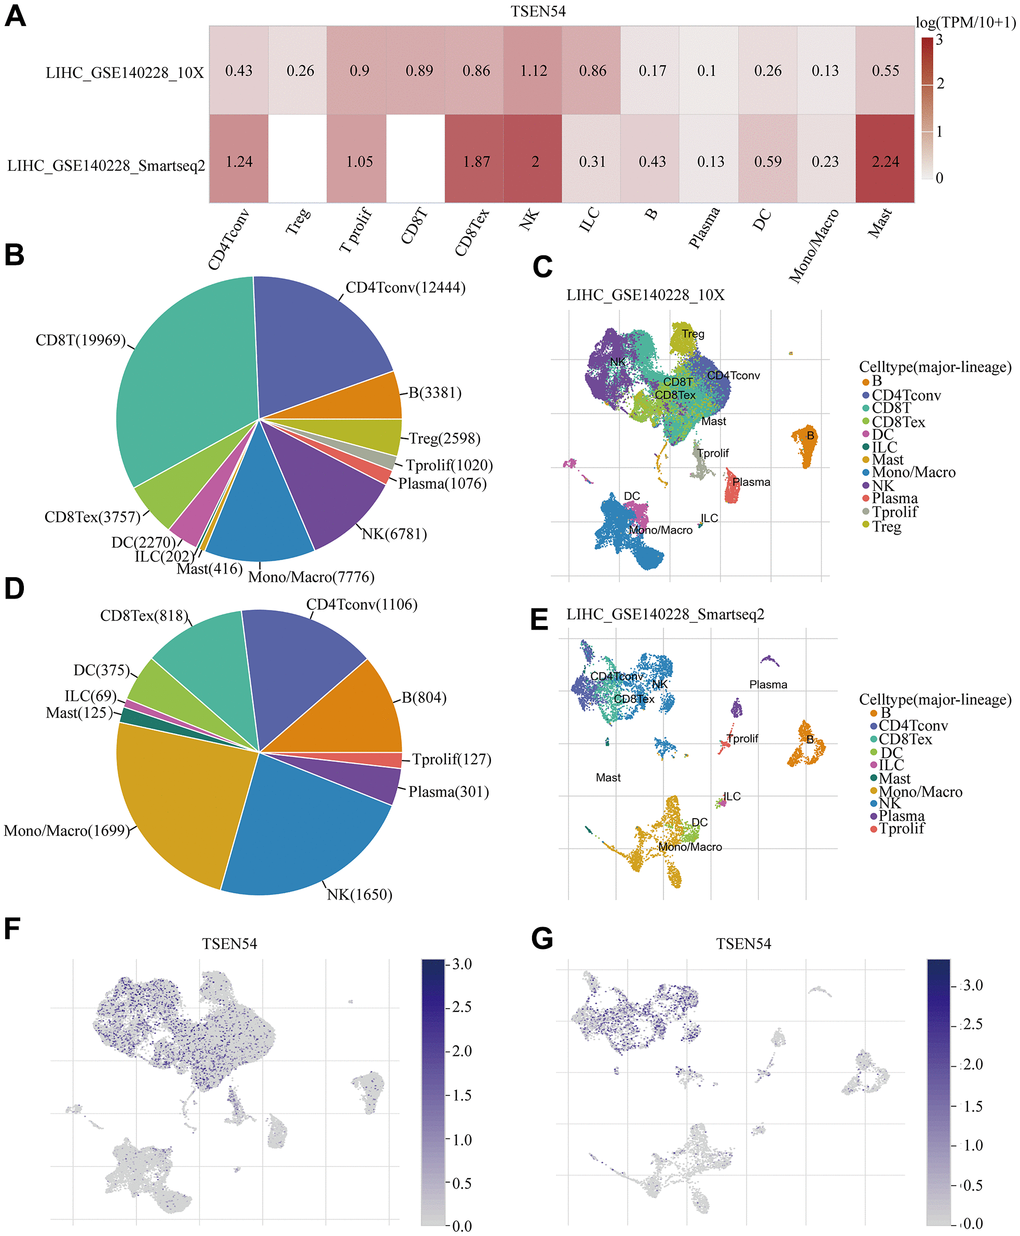
Figure 10.Expression of TSEN54 in HCC at the single cell level. (A) Heatmap reveals the expression level of TSEN54 in a variety of immune cells on LIHC_GSE140228_10× and LIHC_GSE140228_Smartseq2 datasets. (B–E) Types and distribution of cells in the LIHC_GSE140228_10× and LIHC_GSE140228_Smartseq2 datasets. The t-SNE plots describe the distribution of TSEN54 expression in (F) LIHC_GSE140228_10× and (G) LIHC_GSE140228_Smartseq2 datasets of individual cell clusters.