Submit an Article
Navigate
Home
Editorial Board
Editorial Policies
Current Volume
Archive
Scientific Integrity
Publication Ethics Statements
Interviews with Outstanding Authors
Newsroom
Sponsored Conferences
Podcast
Contact
Special Collections
Submit an Article
Online ISSN: 1945-4589
Research Paper
|
Volume 15, Issue 7
|
pp. 2541–2553
Identification and validation of anoikis-associated gene SNCG as a prognostic biomarker in gastric cancer
Back to article
Figure 5
(5 of 8)
−
100%
+
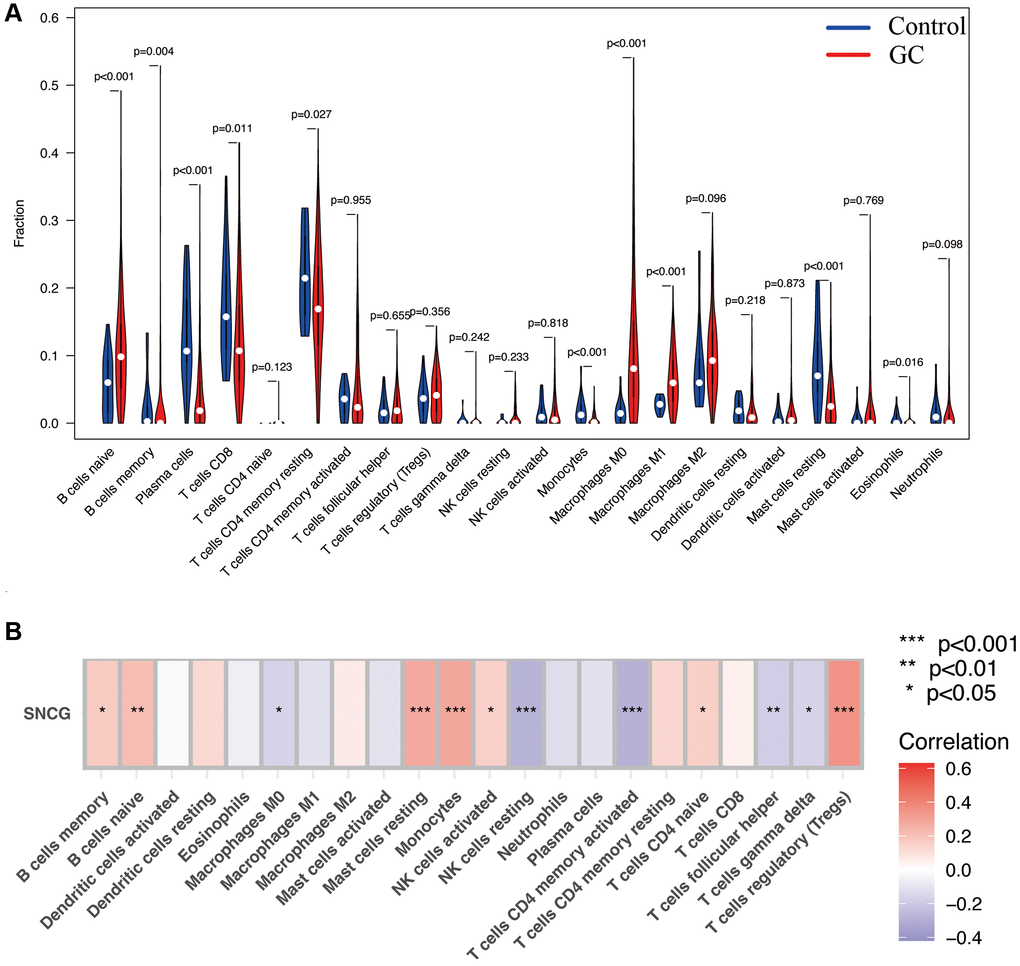
Figure 5.
Immune infiltration analysis.
(
A
) The proportion of 22 types of immune cells between normal control and GC samples. (
B
) Correlation heatmap depicting correlations between infiltrated immune cells and SNCG in GC.